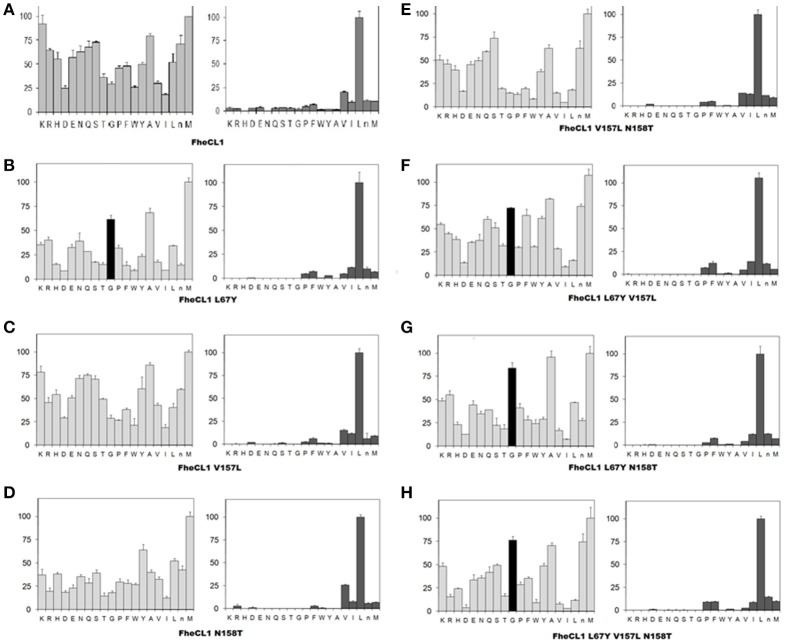
Figure 3.
Profiling of the P2 and P3 substrate specificity of FhCL1 enzyme variants using PS-SCL (A–H). The y axis shows the enzymatic activity, against each of the 20 sub-libraries with P2 and P3 position of the substrates fixed, as a percentage relative to the highest activity in each library (the hydrolysis rates for the Leu- and Met- fixed peptide pools at P2 and P3, respectively, are taken as 100%). The x axis shows the different fixed amino acids using the one-letter code (n = norleucine). The error bars display the standard deviation from triplicate experiments.

