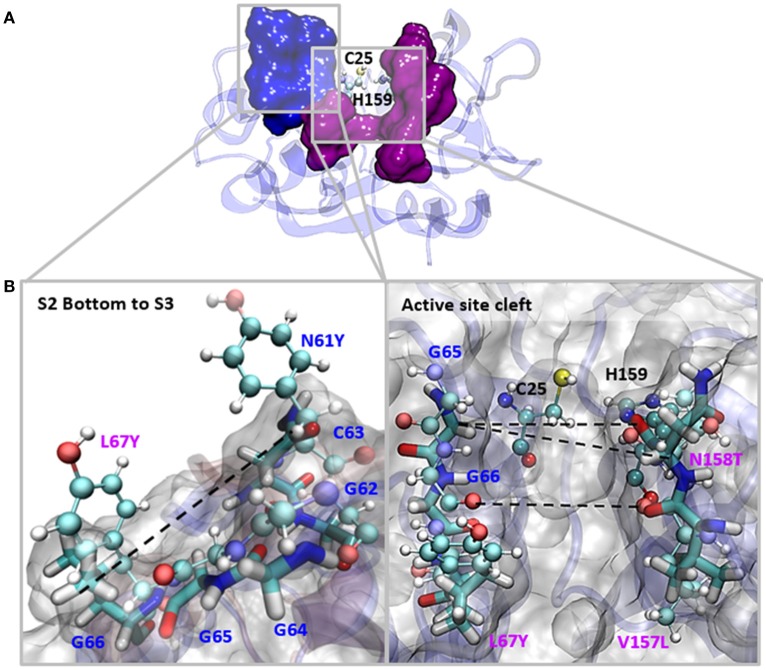
Figure 5.
Interatomic distances between residues in the S2 and S3 sites in MD simulations. (A) The most representative structure for FhCL1 is depicted in blue new cartoons, in ball and sticks are depicted Cys25 and His159; blue surface represents the S3 residues and pink surface represents the S2 residues. (B) We zoomed the regions in the squares and show the measured distances with dashed lines. Blue labels show the S3 residues and pink labels show the S2 residues. FhCL1 residues are depicted in sticks and FhCL2 residues are represented in ball and sticks.

