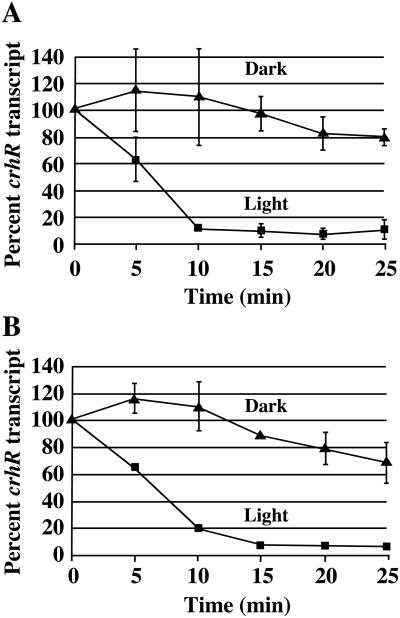
Figure 4.
crhR transcript stability is differentially regulated by light and Glc. crhR transcript levels are expressed as a percentage of crhR mRNA in illuminated cultures. Statistical analysis was performed as described in Figure 3. A, Photoautotrophic Synechocystis cultures were treated with rifampicin and white light or darkness for the times indicated. Statistical analysis indicates all time points except 0 and 5 min are significantly different between light and dark treatments. B, Cultures grown in the presence of Glc were treated with rifampicin and white light or darkness for the times indicated. Statistical analysis indicates all time points except 0 are significantly different between light and dark treatments.

