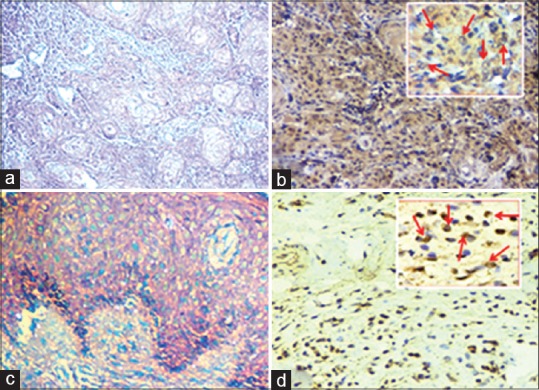
Figure 2.

Photomicrograph showing HE section and immunohistochemistry images of diagnosis and H-Ras protein expression: (a) HE-stained tissue section of oral squamous cell carcinoma (OSCC) case (digital magnification, ×100), (b) IHC image showing strong cytoplasmic immunoexpression in oral squamous cell carcinoma (DAB, digital magnification, ×100), Inset shows the brown color-stained H-Ras positive cells (OSCC) (DAB, digital magnification, ×400), (c) HE of normal tissue section of nonmalignant lesions of oral cavity (digital magnification, ×100), (d) Weak immunostaining in normal tissue (DAB, digital magnification, ×100), Inset shows brown colored H-Ras positive cells (DAB, digital magnification, ×400)
