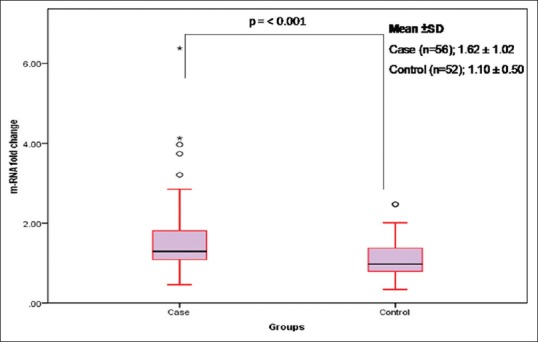
Figure 3.

Relative messenger RNA expression of the H-Ras gene in case and control groups. Prominent horizontal line and star marks of boxes present the median and extreme values of fold change. Upper and lower bars present the distance of the 10th to 90th percentile from the median. The open circle indicates to outliers
