Figure 3.
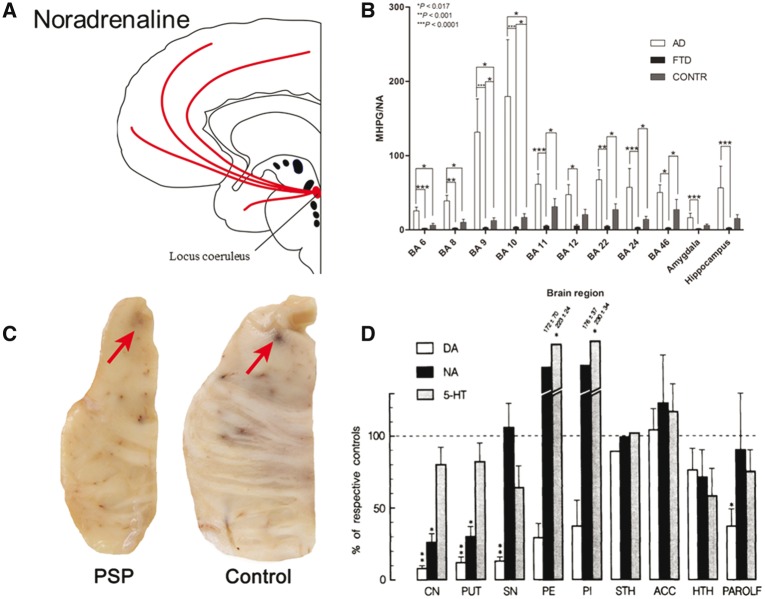
Noradrenergic deficits in FTD and PSP. (A) Schematic illustration of noradrenergic pathways. (B) MHPG/noradrenaline ratios, indicative of catabolic noradrenergic turnover, are reduced in Brodmann areas 11, 22, 24 and 46 in FTD. From Vermeiren et al. (2016). Reprinted with permission from the authors and IOS Press. The publication is available at IOS Press through http://dx.doi.org/10.3233/JAD-160320. (C) Post-mortem brainstem tissue from control and PSP brains. There is a paler locus coeruleus suggesting loss of melatonin-containing noradrenergic neurons. Courtesy of Kieran Allison, Cambridge Brain Bank. (D) Noradrenaline levels are reduced in the caudate (CN), putamen (PUT), hippocampus (HTH) and parolfactory cortex (PAROLF). Serotonin levels are reduced in those areas as well as in the subthalamic nucleus (SN). Dopamine levels are reduced in those areas as well as the globus pallidus externa (GPe) and interna (GPi). From Hornykiewicz and Shannak (1994). Reprinted with permission from Springer.

