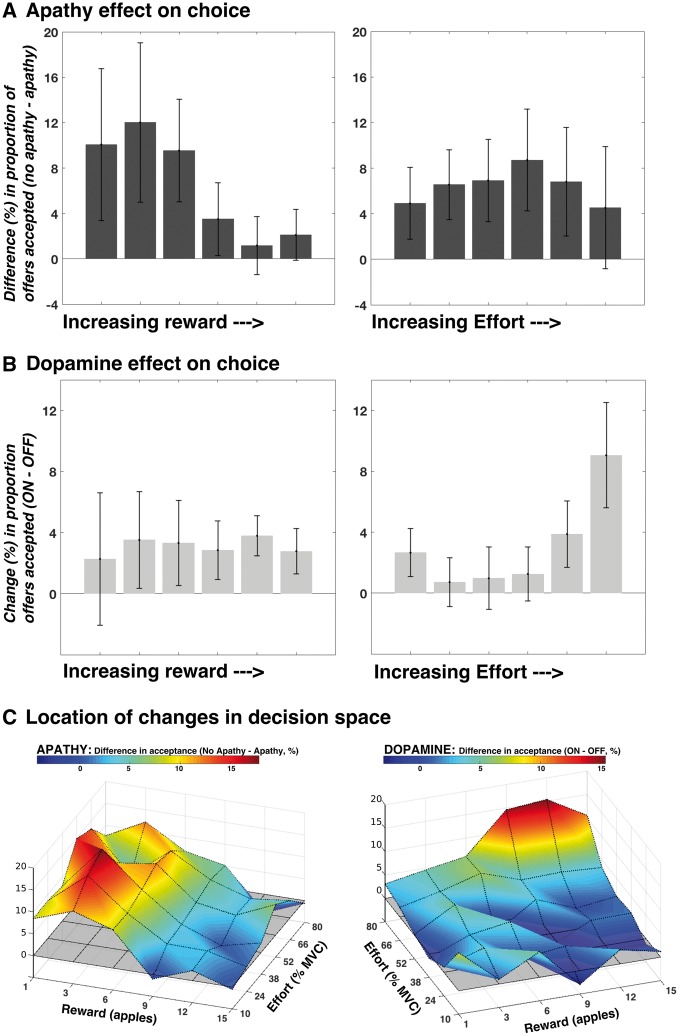
Figure 3.
Distinct effects of apathy and dopamine depletion on response pattern. Change in acceptance in apathetic compared to non-apathetic patients, as both reward and effort increase. The panels show difference in responding (% accepted in no apathy group − % accepted in apathy group) at each reward level, collapsed across effort (A, left) and effort level, collapsed across reward (A, right). The reduced acceptance rate seen in apathetic patients was driven by reduced responding to low reward offers, particularly when effort costs were lower (Apathy × Reward × Effort interaction P = 0.004). A different behavioural pattern characterized the effects of dopamine depletion (OFF state) on choice. Panels show the mean change in acceptance (ON minus OFF) across patients, as reward (B, left) and effort (B, right) increases. The difference between ON and OFF states was driven by increased responding to predominantly high effort, higher reward offers (Dopamine × Reward × Effort interaction P = 0.003). These differences in acceptance rates associated with apathy (C, left) and dopamine depletion (C, right) manifest within distinct regions of the 6 × 6 decision space grid. The grey shaded plane (z-axis = 0) represents no difference in acceptance. All error bars are ± SEM. PD = Parkinson’s disease.

