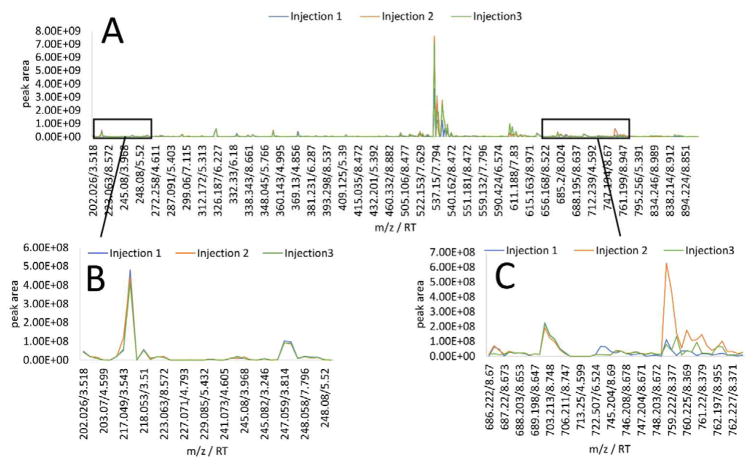
Figure 2. Spectral variable inspection of triplicate injections from the second pool from the five-pool, 0.01 mg mL−1 data subset.
2A. Overlaid spectral variable plots of triplicate injections in which peak areas of each variable are plotted for comparison. 2B. Spectral variables associated with the sample under analysis. Overlapping traces are consistent from injection to injection. 2C. Spectral region associated with chemical contamination showing a variance/mean peak area ratio greater than 1.0 × 10⁷.

