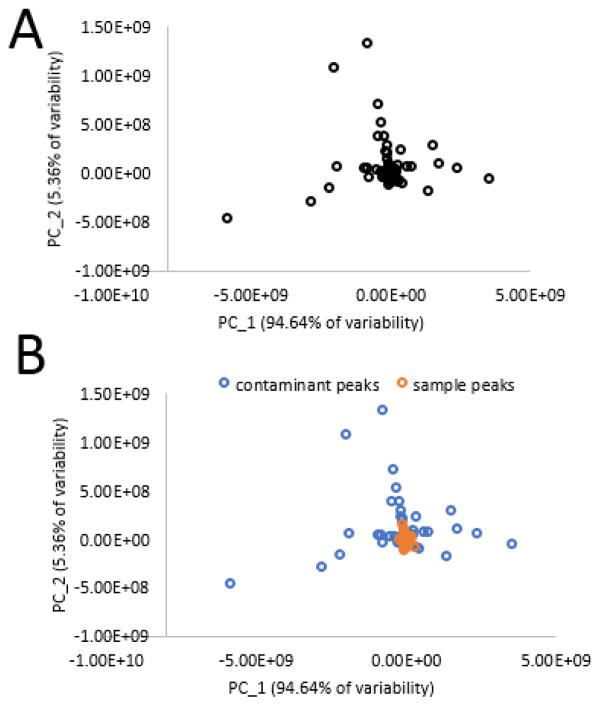
Figure 6. PCA loadings plot of triplicate technical replicates from pool one of the ten-pool, 0.01 mg mL−1 data subset.
6A. Loadings plot illustrating all variables contributing to group separation. 6B. Color-coded loadings plot allowing visualization of contaminant and sample peak influence on group separation. Many of the chemical contaminants are close to the center cluster, and would not be reliably identified using PCA loadings alone.

