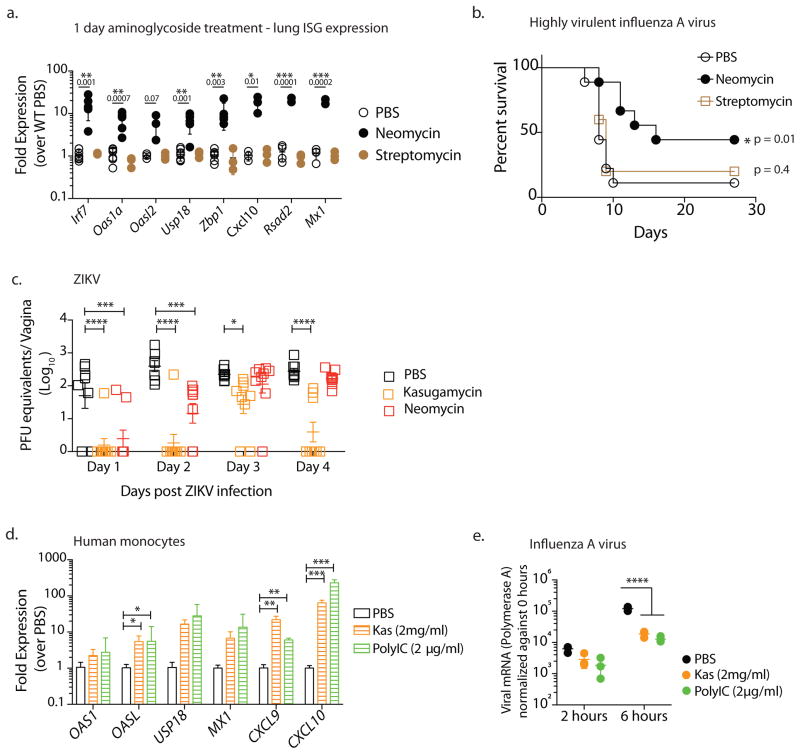
Figure 3. Aminoglycosides confer broad protection against both RNA and DNA viruses.
Mice were treated intranasally with 2 mgs neomycin or streptomycin (data pooled from two independent experiments, one with PBS and Neomycin groups (n=4) and the second which contained PBS, Neomycin and Streptomycin treatment groups (n=3)) and gene expression analyzed 24 hours later in lung tissue (a). Error bars represent SD and significance was calculated using multiple t-tests with Holm-Sidak correction for multiple comparisons. Mx1 congenic mice (data pooled from 2 independent experiments, one which contained PBS and Neomycin groups (n=4) and the second with PBS, Neomycin and Streptomycin treatment groups (n=5)) were pretreated intranasally with the indicated aminoglycoside (2mgs) or PBS and infected 24 hours later with highly virulent influenza strain PR8 and survival curves compared using a log rank (Mantel-Cox) test (b). Depo-treated mice (n=7–8, data pooled from two independent experiments) received intravaginal aminoglycoside or PBS daily for 6 days and were infected with 25,000 PFU ZIKV intravaginally and vaginal viral titers were calculated via qPCR. Error bars represent SEM and significance was calculated using 2-way ANOVA with Fisher’s LSD test. (c). Primary human monocytes were treated with kasugamycin (2mg/ml) or Poly I:C (2μg/ml). Six hours after treatment, gene expression was analyzed (n=3 replicates per treatment). Error bars represent SD and significance was calculated using multiple t-tests with Holm-Sidak correction for multiple comparisons (d). In a separate experiment, kasugamycin-treated monocytes were infected with Influenza A/PR/8/34 (H1N1) strain at a multiplicity of infection of 2 and RNA collected 2 and 6 hours post infection (n=3 replicates per treatment). Virus levels were quantified via qPCR using primers against Polymerase A. Error bars represent SD and significance was calculated using 2-way ANOVA with Fisher’s LSD test (e). * represents p values <0.05 and exact p values are reported in Supplementary Table 2. Experiments shown in d,e were repeated independently with similar results.

