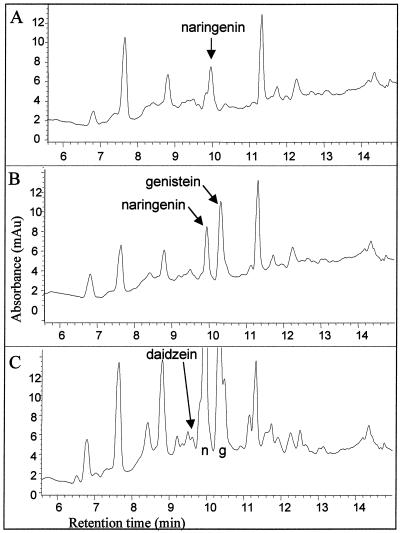
Figure 4.
Production of genistein and daidzein in transformed BMS cell lines. HPLC chromatogram at 260 nm of extracts from BMS cell lines transformed with CRC (A), CRC and IFS (B), and CRC, IFS, and CHR (C). Peaks corresponding to retention times and spectra of naringenin, genistein, and daidzein are labeled. n and g designate naringenin and genistein peaks, respectively.

