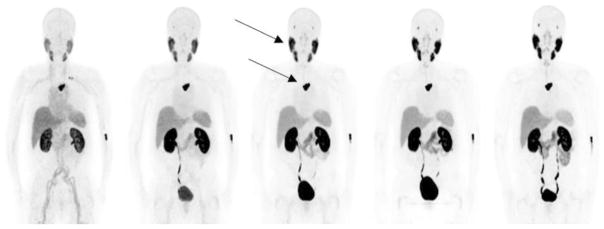
Fig. 4.
Maximum intensity projection PET images in a representative patient. The images show physiological tracer uptake in the salivary glands (upper arrow), lacrimal glands, kidneys, liver, spleen, small intestine and urinary excretion. Uptake is also seen in a metastatic lesion in the spine (lower arrow).

