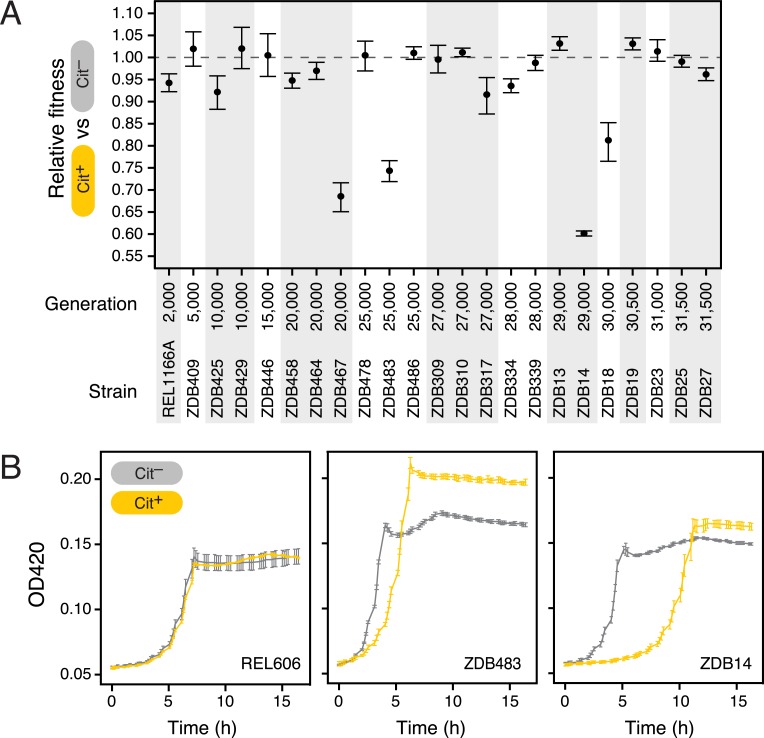
Fig 2. Fitness consequences of evolving Cit+ in different evolved genetic backgrounds.
(a) Results of the Prnk-citT knock-in assay on 23 pre-Cit+ evolved strains. The clones are ordered by the generation from which they were isolated. Error bars are 95% confidence intervals. Strain construction details and how the results of competition assays were combined into these fitness estimates are described in the Methods and S1–S4 Figs. (b) Increased lag phase upon addition of the Prnk-citT module in anti-potentiated strains. Growth curves for the ancestor, REL606, and two anti-potentiated strains, ZDB483 and ZDB14, are shown. Error bars are standard deviations of four replicate cultures.

