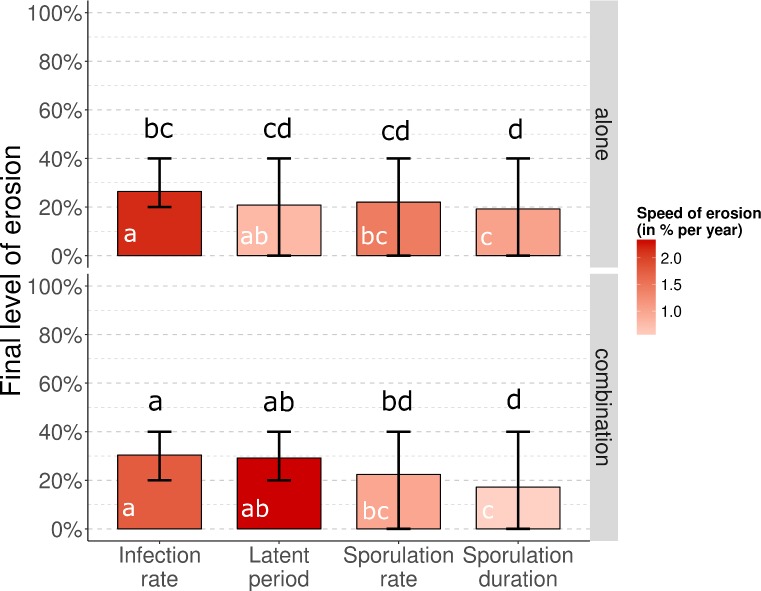
Fig 6. Evolutionary outcomes for Puccinia rusts after 50 years: Final level of erosion of quantitative resistance traits.
Quantitative resistance (efficiency ρw = 50%) is deployed alone (top row) or in combination with a major resistance gene (bottom row). The red shading indicates the average speed of erosion from the time when quantitative erosion starts to erode to the time when the final level of erosion is reached, with darker shades representing faster erosion rates. Lower case letters indicate statistically different groups for final level (black) and speed (white) of erosion, according to pairwise comparison tests (Dunn’s test with Holm correction). Every scenario is replicated 50 times. Vertical bars represent the 90% central range.

