
Figure 1.
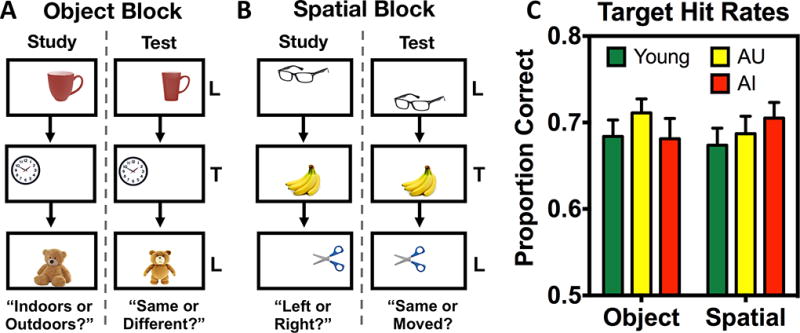
Task schematic and target recognition performance. A) Illustrative diagram of an object block with an “indoor/outdoor” study sequence and a “same/different” test sequence. Two object blocks were completed. B) Illustrative diagram of a spatial block with a “left/right” (of center) study sequence and a “same/different” test sequence. Two spatial blocks were completed. Objects were smaller relative to screen size in the actual task, and presentation order was randomized across runs (i.e., study and test orders were different) and across participants. Stimuli were presented for 2.5 seconds, with a 0.5 second inter-stimulus interval. C) Target hit rates for young, AU, and AI groups across object and spatial discrimination blocks. Data are shown as mean ± standard error.