
Figure 4.
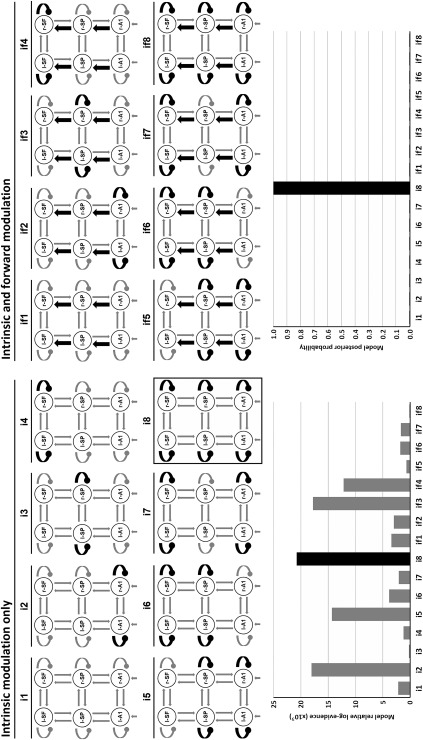
DCM study for studying diagnosis and genetic risk. Top: sixteen studied models including bilateral intrinsic (black oval arrows) and/or forward extrinsic (black pointed arrows) modulation. These models included eight bilateral combinations of intrinsic connectivity (i) and two extrinsic combinations: with and without forward (f) modulation. Bottom: relative log‐evidences and posterior probabilities for each model. The winning model “i8” included intrinsic modulation at the three hierarchy levels. l‐/r‐A1: left/right primary auditory cortices; l‐/r‐SP: left/right superior parietal lobules; l‐/r‐SF: left/right superior frontal gyri.