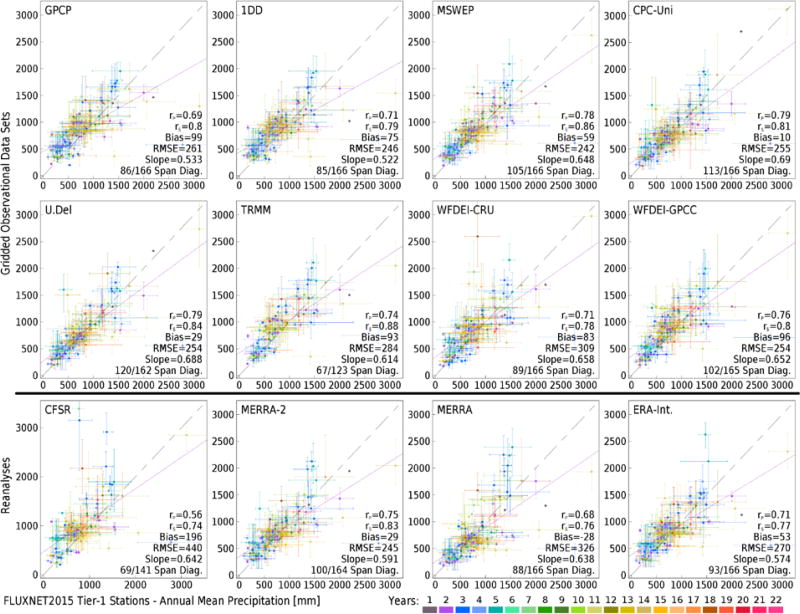
Figure 2.
Scatter of annual total precipitation measurements at FLUXNET2015 sites (abscissa) to estimates (ordinate) from gridded observationally-based precipitation analyses (top two rows) or reanalyses constrained by data assimilation (bottom row) using the value from the grid box containing the FLUXNET2015 site location (unless data are missing or indicated to be an all-ocean grid box). Dash-dotted diagonal grey line indicates X=Y. Colors indicate years of available data from each FLUXNET2015 site, whiskers span range of annual totals from FLUXNET2015 (horizontal) or gridded estimates (vertical) for years where data sets overlap. Purple line is the best-fit linear regression of Y on X. Statistics are explained in the text.

