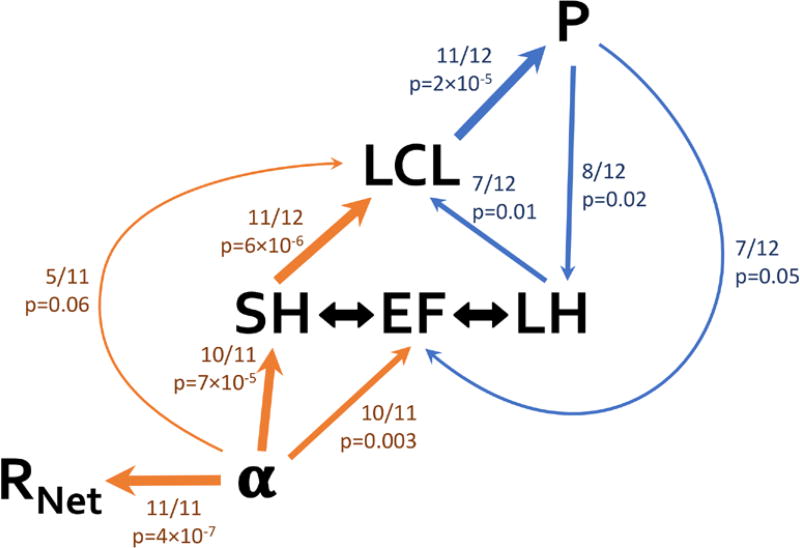
Figure 5.
Propagation of errors estimated from their rank correlations among precipitation (P), height of the lifting condensation level (LCL), evaporative fraction (EF), sensible and latent heat flux (SH & LH), surface albedo (α) and net radiation (RNet) across FLUXNET2015 stations. Ratios show the number of models out of 11 (correlations involving α) or 12 (other variables) with p-values below 0.10; p-value shown is based on the average of correlations across all models. Widths of arrows follow significance of correlations and no arrows are drawn where p-values are large. The wide double arrows between EF and heat fluxes denote p-values < 10−12.

