
Figure 1.
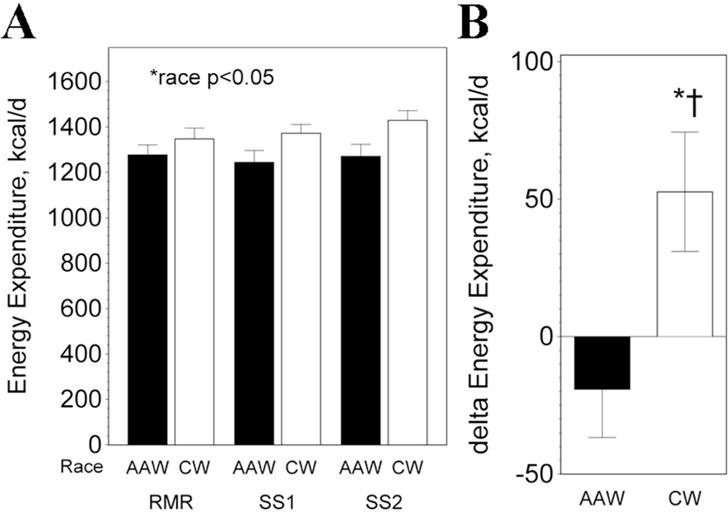
Energy expenditure. A) Energy expenditure was significantly lower in AAW (p<0.002). B) Delta energy expenditure during clamp (average of SS1 and SS2) compared to baseline REE. *significant change, p<0.03; †change significantly different between AAW and CW during clamp, p<0.04.