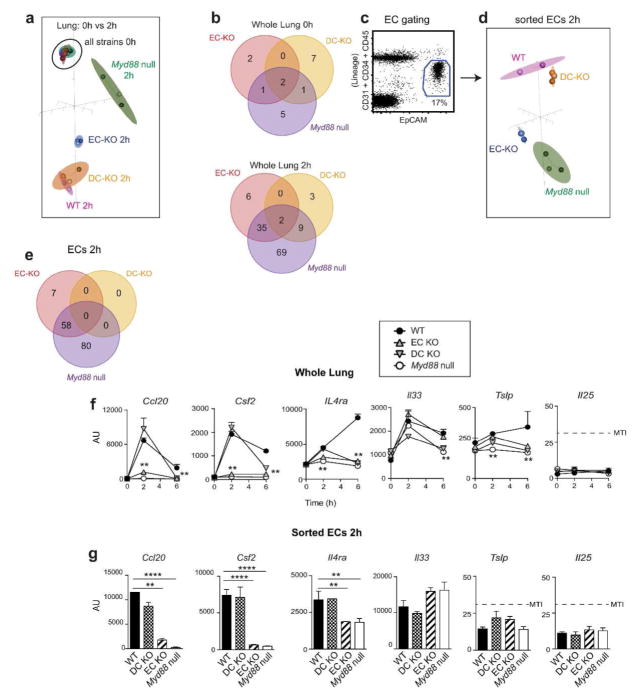
Figure 3. Immune gene expression in whole lung and ECs at 2h post-sensitization.
(a) BGA plot of immune gene expression in whole lung at 0 and 2h after OVA/FLA-mediated sensitization of the indicated mouse strains. (b) Venn diagram showing the number of genes differentially expressed (≥1.5 fold; p≤0.01, MTI≥32 for at least one group) between lungs of WT mice (reference group) and the indicated mouse strains at 0 (top) and 2h (bottom) post-sensitization. (c) Gating strategy for purification of ECs. (d) BGA plot of immune gene expression in sorted ECs of the indicated mouse strains at 2h post-sensitization. (e) Venn diagrams showing the number of genes differentially expressed between sorted ECs of WT mice and the indicated strains (≥1.5 fold; p≤0.01, MTI≥32 for at least one group). (f–g) Expression of genes in whole lung (f) and ECs at 2h post-sensitization (g). n = 3 mice per group. MTI = minimum threshold intensity for gene detection, **p < 0.01, ****p < 0.0001.

