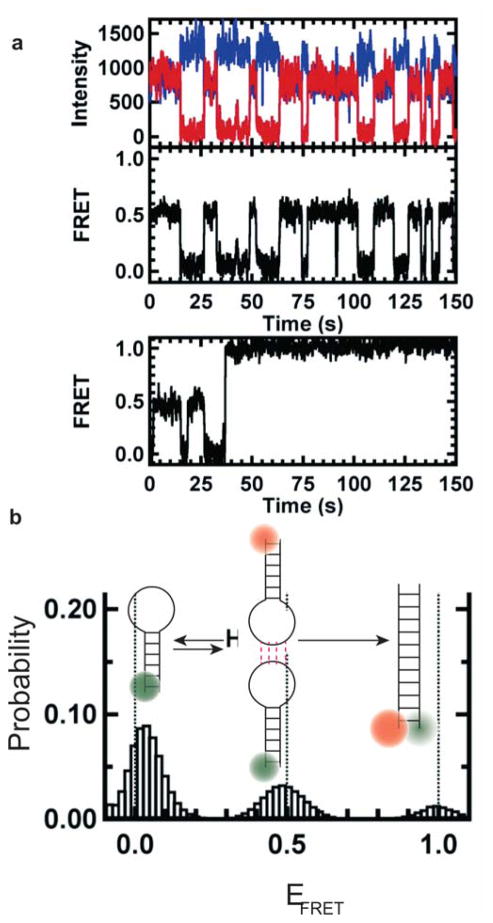
Figure 6. smFRET studies of RNA kissing-loop interaction.
(a) Typical single-molecule time traces with donor (blue) and acceptor (red). The corresponding FRET trajectory shows states with FRET efficiencies of 0.0 and 0.5, representative of single hairpin and assembled kissing complexes, respectively. The bottom panel shows a FRET trace in which after several kissing interactions extended duplex formation is observed in real time. (b) FRET efficiency histogram shows 0.0, 0.5 and 1.0 FRET states representative of single hairpin, kissing complex formation and extended duplex formation. Each schematic represents the corresponding states. After formation of the duplex, the molecules are trapped in that form under experimental conditions. Reproduced with permission from Ref 198 Copyright 2012 Biophysical Society.

