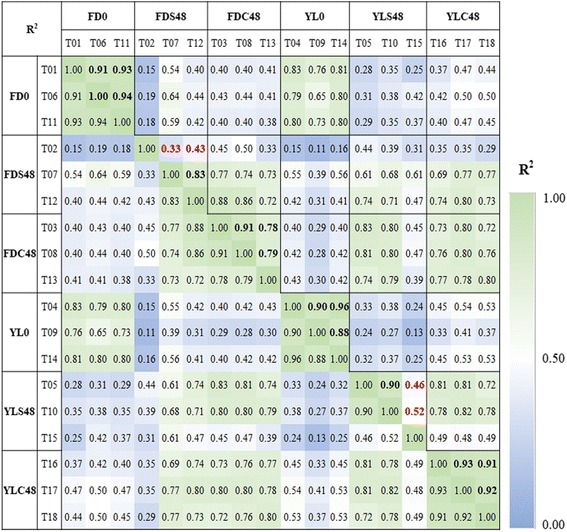
Fig. 4.

Correlation analysis of the samples for differential expression analysis. Different sample numbers represent un-pollinated ‘Fudingdabai’ pistils (FD0), self-pollinated ‘Fudingdabai’ pistils at 48 h (FDS48), ‘Yulv’(♂) × ‘Fudingdabai’(♀) at 48 h (FDC48), un-pollinated ‘Yulv’ pistils (YL0), self-pollinated ‘Yulv’ pistils at 48 h (YLS48) and ‘Yulv’(♀) × ‘Fudingdabai’(♂) at 48 h (YLC48), respectively. Bold values are R2 for replicates of each sample
