
Fig. 7.
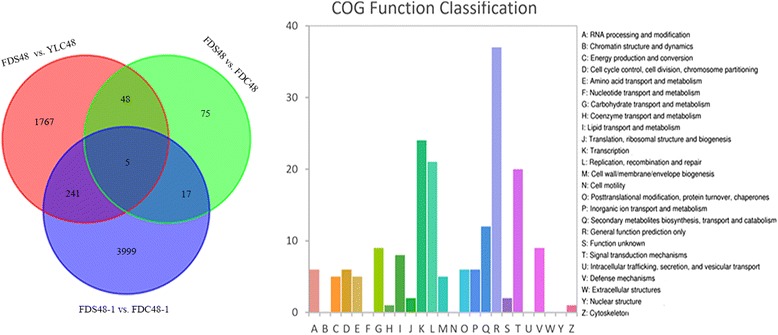
Venn diagram and COG function classification for DEGs identified between self- and cross-pollinated groups. FDS48–1 and FDC48–1 are self- and cross pollinated samples from the study by Zhang et al.
Official websites use .gov
A
.gov website belongs to an official
government organization in the United States.
Secure .gov websites use HTTPS
A lock (
) or https:// means you've safely
connected to the .gov website. Share sensitive
information only on official, secure websites.
Venn diagram and COG function classification for DEGs identified between self- and cross-pollinated groups. FDS48–1 and FDC48–1 are self- and cross pollinated samples from the study by Zhang et al.