
Fig. 1.
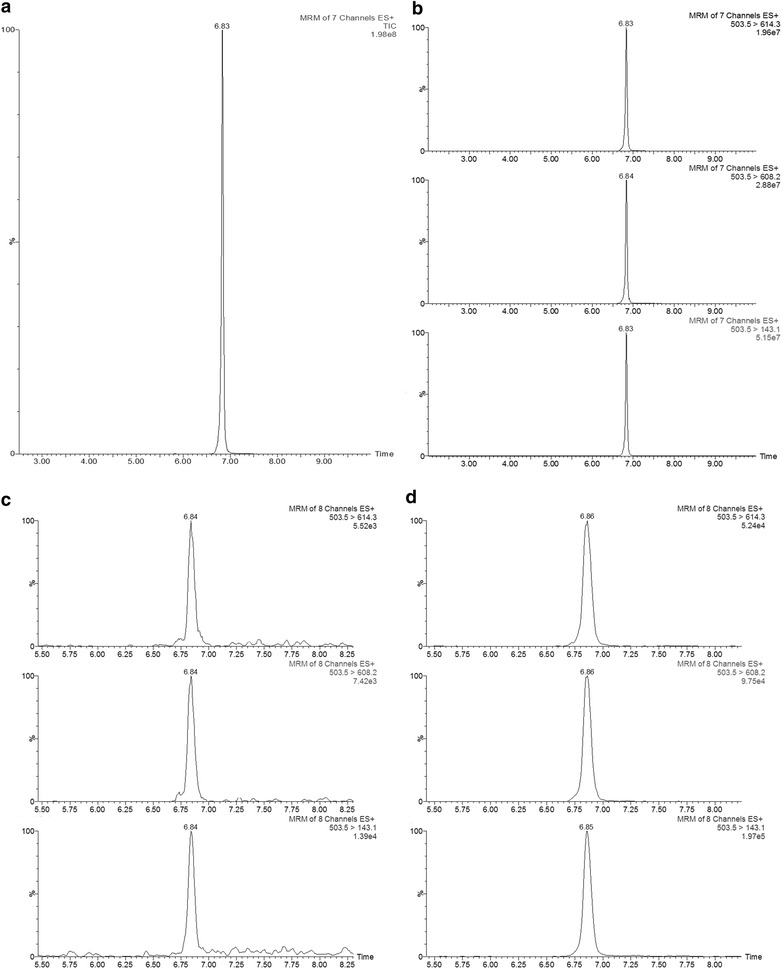
HPLC–MS/MS chromatograms for SYS in standard and plant samples. Main chromatograms obtained by 100 ng ml−1 of pure standard in H2O: ACN (9:1) v/v as both a total ion current of SYS in ESI (+) and b the three SRM transitions of the SYS standard. c SYS chromatogram for the three transitions obtained for SYS in the tomato plant sample and d the chromatogram for the same type of plant sample spiked with 150 ng ml−1