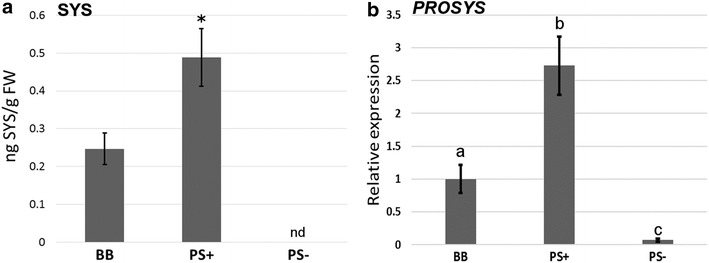
Fig. 3.

Quantification of SYS and expression of the PROSYS gene in tomato leaves. Levels of a SYS peptide and b PROSYS gene expression in leaves of tomato plants in wild-type plants (BB), the overexpressor of PROSYS (PS+) and the antisense of PROSYS (PS−). Data represent the mean and standard deviation (n = 6). The experiment was repeated three times, and asterisks indicate significant differences as determined by Student’s t-test, α = 0.05. No detection represented by nd. Different letters indicate statistically significant differences (ANOVA, Fisher’s least significant difference (LSD) test, p > 0.05, n = 6)
