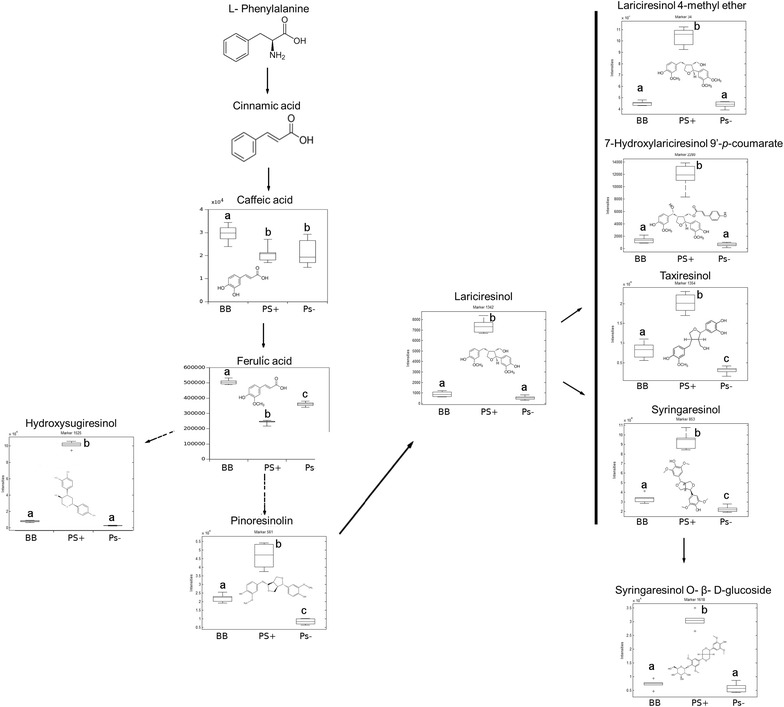
Fig. 5.

Profile of selected lignans and their precursor metabolites. 6-week-old plants were processed for relative quantification analysis in a UHPLC-QTOF MS. The metabolite concentration of each metabolite was normalized by using the chromatographic area for each compound with the dry weight of the corresponding sample. The third and fourth leaves of 3 individual plants 6-weeks-old was harvested and pooled for each genotype. Box plots represent the means for three independent experiments with two technical replicates. Different letters indicate statistically significant differences (ANOVA, Fisher’s least significant difference (LSD) test, p > 0.05, n = 6)
