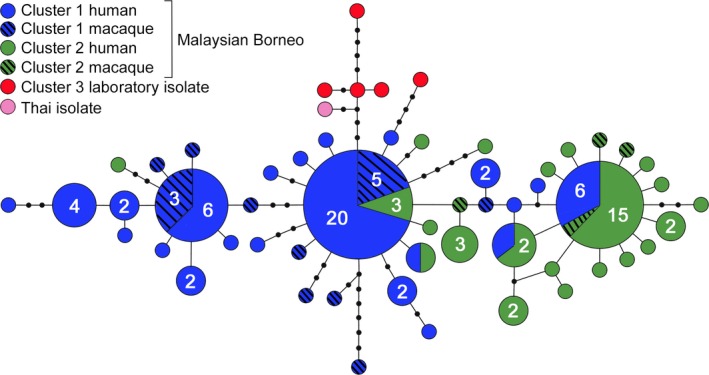
Figure 5.

Genealogical network based on 129 Plasmodium knowlesi mitochondrial DNA genome sequences showing 56 different haplotypes. Sizes of the circles represent relative numbers of samples with each haplotype, with numbers specified where this is more than one. Connecting lines each represent one mutational step, and black dots represent missing intermediate haplotypes [Colour figure can be viewed at http://wileyonlinelibrary.com]
