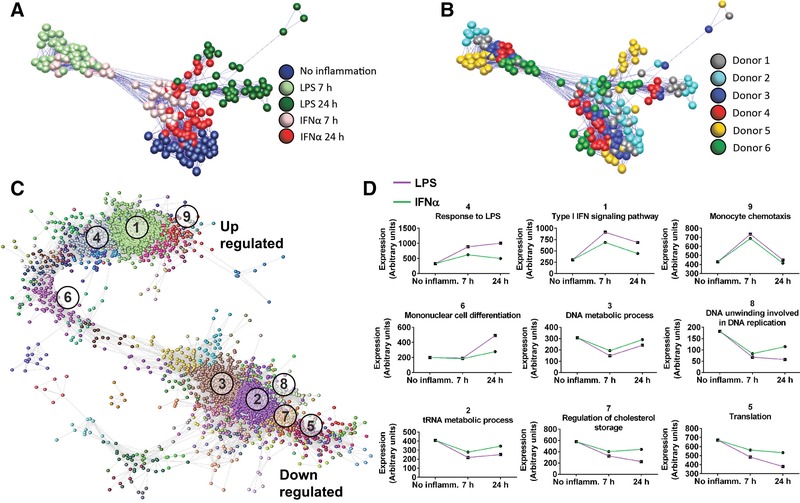
Figure 2.

Network analysis of the effects of inflammatory challenge and drug treatment on the transcriptome. Sample‐sample correlation network constructed from the normalized microarray dataset colored according to (A) inflammatory stimulus or (B) by donor. Nodes represent samples within the dataset and edges represent correlations between samples greater than the threshold (r > 0.96). Samples closer to each other are more similar (highly correlated). Separation of the samples is observed by inflammatory stimulus and by donor. (C) A gene–gene correlation network constructed from DEGs from the microarray dataset (r > 0.93). Nodes represent genes which cluster together based on their pattern of expression. (D) Mean signal intensity of the genes in 9 of the largest clusters are displayed on the right with GO functional enrichment terms (numbered in order of size)
