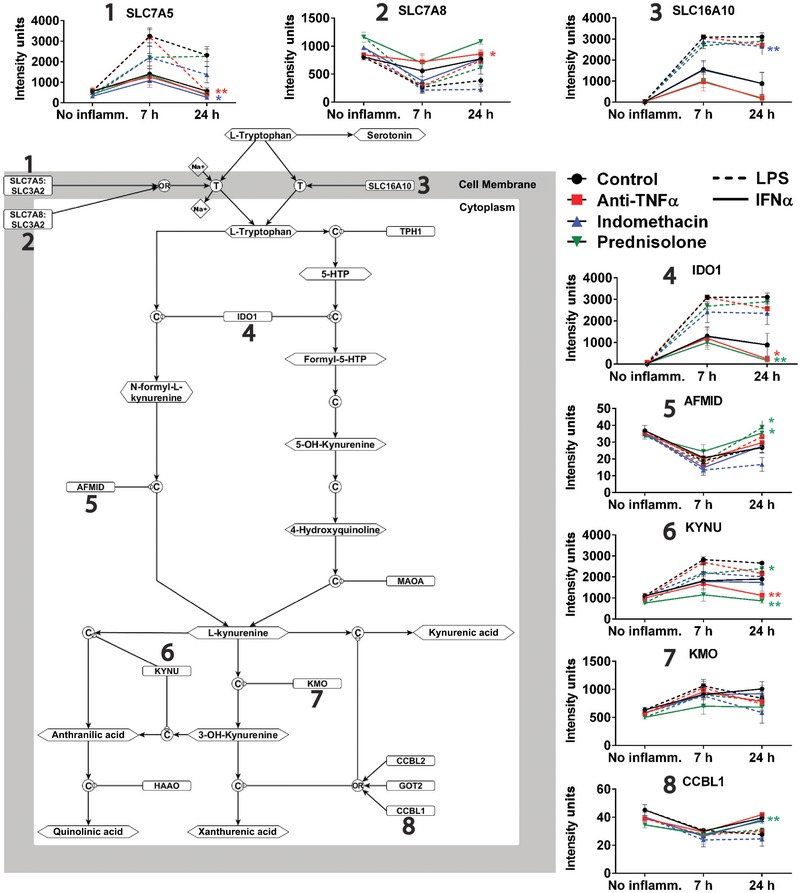
Figure 4.

Effects of proinflammatory challenge and anti‐inflammatory drugs on expression of genes related to tryptophan and kynurenine metabolism. The pathway model summarizes the metabolic role of 8 proteins involved in tryptophan transport or catabolism as illustrated. The profile of expression changes for each gene following proinflammatory challenge is shown by the line graphs during each drug treatment. Significance is depicted for every significant interaction of anti‐inflammatory drug treatment with proinflammatory challenge, and color coded for each drug treatment. *P < 0.05, **P < 0.01
