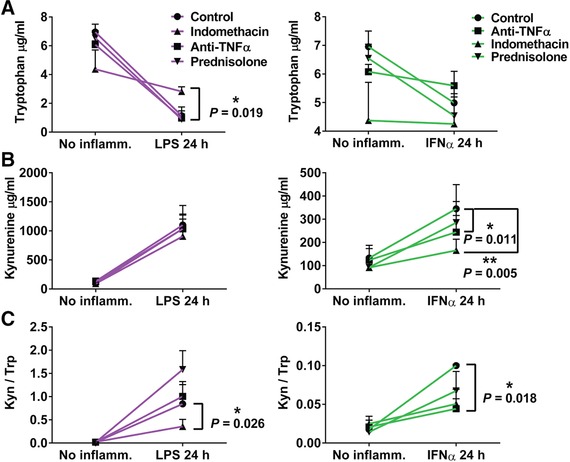
Figure 5.

Metabolomic analysis of effects of inflammatory challenge and anti‐inflammatory drug treatment on tryptophan concentration and tryptophan/kynurenine concentration ratio. Tryptophan (A) and kynurenine (B) concentrations in cell culture supernatants 24 h after pretreatment of the 3 anti‐inflammatory drugs before each inflammatory challenge. (C) Ratio of kynurenine to tryptophan levels detected in the supernatant. Significance was calculated using a ratio paired t test. *P < 0.05 **P < 0.001
