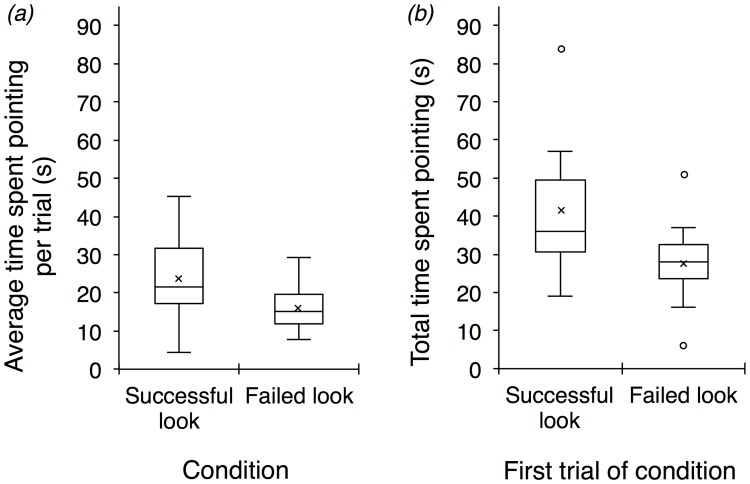
Fig 2.
(a) On average, subjects spent more time pointing at the grapes per trial in the successful-look condition than in the failed-look condition (p = 0.016). (b) Subjects also spent more time pointing at the grapes in the first trial of the successful-look condition than in the first trial of the failed-look condition (p = 0.009). Results depicted are for points with eye contact. Box plots represent the interquartile range, minimum, and maximum values; depicted also are the means (crosses), medians (horizontal lines), and outliers (circles).

