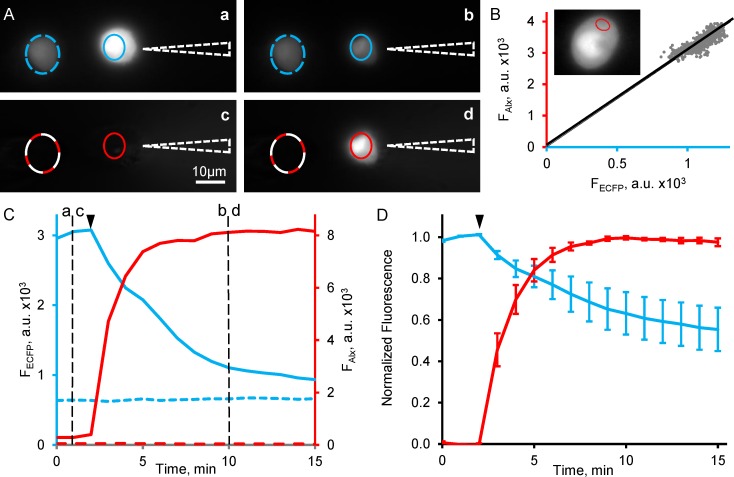
Fig 3. Estimation of ECFP concentration in PC12 cells.
ECFP expressing PC12 cells were filled with Alexa Fluor 594 via patch pipette. (A) Images of two PC12 cells obtained in ECFP (a, b) and Alexa Fluor 594 (c,d) channels right before the cell membrane rupture (a, c) and in 10 min after the rupture (b, d). Images were taken at the moments indicated by black dashed lines in (C). A position of patch pipette are depicted in (A) by white dotted triangles. Scale bar is 20 μm. (B) A correlation plot of ECFP and Alexa Fluor 594 fluorescence intensities for a cytoplasmic part of cell. Each dot in the correlation plot represents a pixel located in a red oval depicted within the cytoplasmic part of cell, of which an image is shown in the insert (ECFP channel). ECFP and Alexa Fluor 594 images used for building the correlation plot were obtained by averaging all frames in ECFP channel taken before the cell rupture and all frames in Alexa Fluor 594 channel between 10 and 15 min. A linear regression without offsets for this plot indicates to reasonable correlation between the fluorescent values (R2 = 0.67). (C) Time courses of cell loading with Alexa Fluor 594 (red traces) and washing out of ECFP (blue traces). Fluorescence intensities for both labels were calculated in ROIs shown in (A) as an average intensity of all pixels within each ROI. Solid and dashed lines in ROIs (A) and time courses (C) correspond to the patched and intact cell, correspondingly. Cell rupture is indicated by black arrowheads in (C) and (D). Alexa Fluor 594 fluorescence (FAlx) reached a plateau in about 5 min after the membrane rupture indicating an equilibrium state at which the concentration of Alexa Fluor 594 inside the cell and in the patch pipette are expected to be equal. Residual fluorescence in ECFP channel indicates that some ECFP molecules (about 30%) are retained in intracellular compartments. Images were taken at the rate of 1 min per frame for each channel in order to minimize photo-bleaching. ECFP photobleaching in a control cell at this frame rate was negligible (dashed blue trace in Fig 3B); thus, it could be also neglected in the patched cells. (D) Time courses from five cells were normalized and averaged, representing a perfusion dynamics of Alexa Fluor 594 (red traces) and washing out of ECFP (blue traces), analogous to those in (C).

