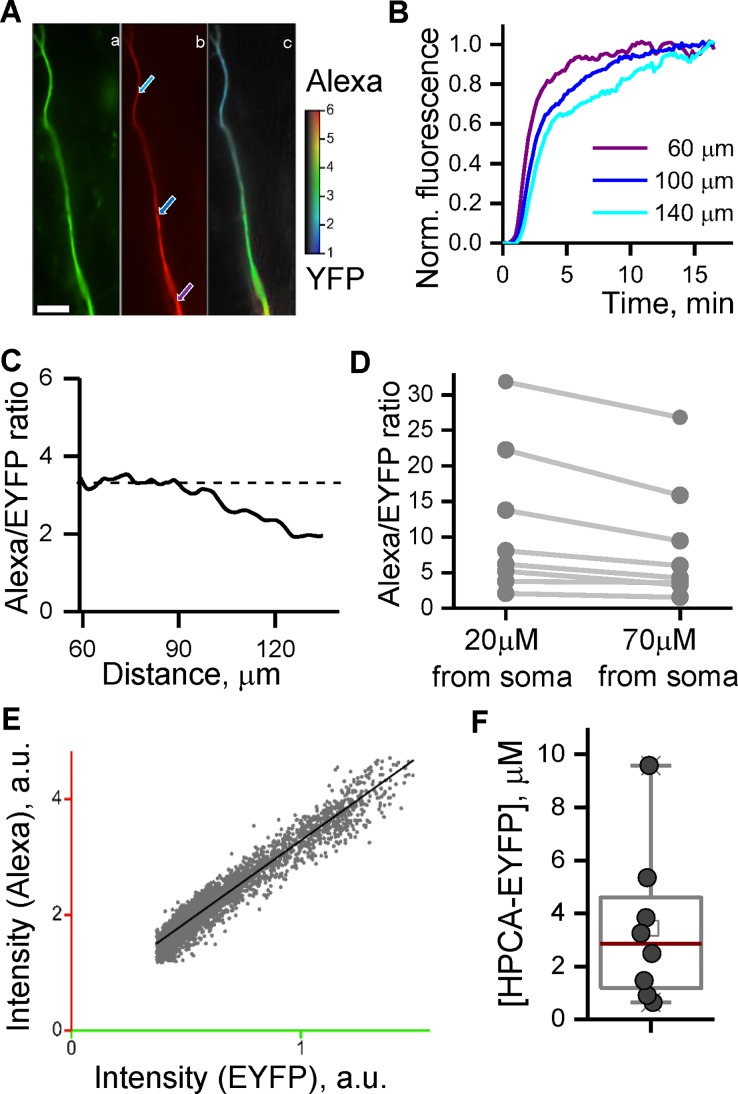
Fig 4. Estimation of HPCA-EYFP concentration in a dendritic tree of cultured hippocampal neurons.
Hippocampal neurons (DIV 10–20) expressing HPCA-EYFP were patched with pipettes filled with an intracellular solution containing Alexa Fluor 594 dye (20–50 μM). (Aa) HPCA-YFP image of dendrite taken at the beginning of experiment, before the membrane rupture. (Ab). Alexa Fluor 594 image of the same area taken in 15 min after cell rupture. Analogous images were taken in other tested neurons and used for obtaining graphs shown in (D) and (F). Arrows denote regions of interest, ROIs, where the fluorescence intensity was measured; the corresponding time courses shown in (B). (Ac). A color-coded ratio of Alexa Fluor 594 to HPCA-YFP fluorescence intensities. Scale bar is 10μm. (B) Intensity of Alexa Fluor 594 fluorescence was measured over time at ROIs indicated by the arrows in (Ab). Intensity profiles are normalized by their maximal values. Colors of the traces correspond to the colors of the arrows in (Ab). (C) A ratio profile of Alexa Fluor 594 to HPCA-YFP fluorescence taken along the dendrite. The plot demonstrates a plateau region up to 100μm from soma where Alexa Fluor 594 wash-in was competed in 15 min after the membrane rupture thus far indicating a range of distances from soma where HPCA-EYFP concentration can be accurately estimated. (D) Ratios of Alexa Fluor 594-to-HPCA-EYFP fluorescence in the proximal and distal parts of the apical dendrites in 15 min after the membrane rupture for 8 tested neurons. The graph demonstrates substantial wash-in of Alexa Fluor 594 in the distal parts of dendrites. A ratio of Alexa/EYFP fluorescence in a distal part normalized to the same ratio in a proximal part was 0.75±0.04. (E) A correlation plot of HPCA-EYFP and Alexa Fluor 594 fluorescence intensities generated for all pixels in the dendrite corresponding to the plateau region in (C) (green region in (Ac)). A linear regression of this plot indicates to a significant linear correlation between HPCA-YFP to Alexa Fluor 594 fluorescence (R2 = 0.87). (F) Estimated dendritic concentrations of HPCA-EYFP in the cytosol pulled from eight tested neurons.

