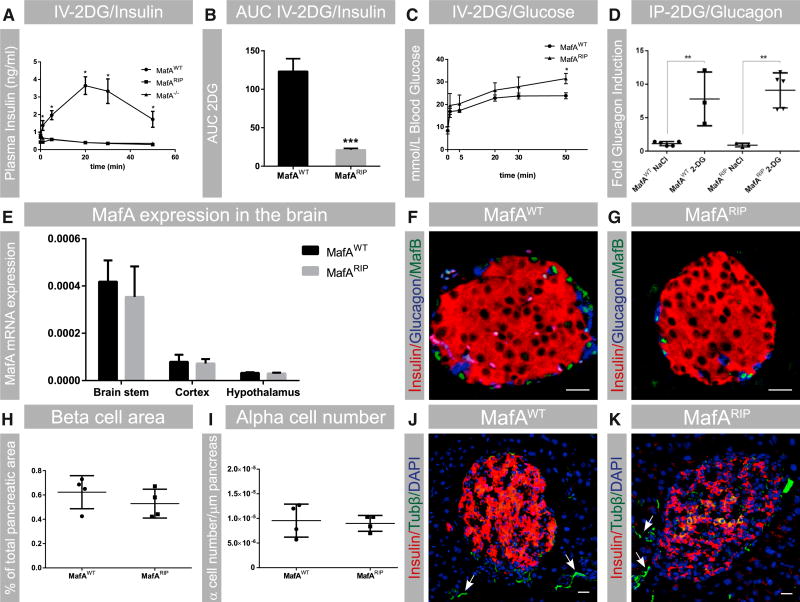
Figure 1. β-Cell-Specific Deletion of MafA Results in Impaired Glucose Clearance and ANS-Stimulated Insulin Secretion.
(A and B) 2DG-stimulated insulin secretion in adult MafAWT, MafA−/−, and MafARIP mice is shown; n = 9 or 10.
(C) Glucose levels in 2DG-treated MafAWT and MafARIP animals; n = 9 or 10.
(D) Glucagon secretion induced by 2DG in MafAWT and MafARIP mice, with saline (NaCl) treatment as a control; n ≥ 3.
(E) MafA mRNA expression in the hypothalamic, cortex, and brainstem regions in MafARIP and MafAWT mice. Data were normalized to the geomean of HPRT and β-actin mRNA levels. n = 4 or 5.
(F and G) Immunohistochemistry staining for MafB (green), α cells (stained for glucagon; blue), and β cells (stained for insulin; red) of freshly isolated pancreatic sections from MafAWT and MafARIP mice.
(H) β cell area in MafARIP and MafAWT mice; n = 4.
(I) α cell area in MafARIP and MafAWT mice; n = 4.
(J and K) Islet innervation in MafAWT and MafARIP mice was assessed by β-tubulin immunostaining (Tubβ; green). Autonomic nerve fibers are denoted by white arrows. Insulin is visualized in red and nuclei in blue (DAPI staining).
Data are presented as mean ± SEM and were analyzed with multiple (A and C) and Student’s (B, D, E, H, and I) t test. *p < 0.05 and **p < 0.01. The scale bar represents 20 µm. See also Table S1 and Figure S1 for additional characterization of MafARIP animals.

