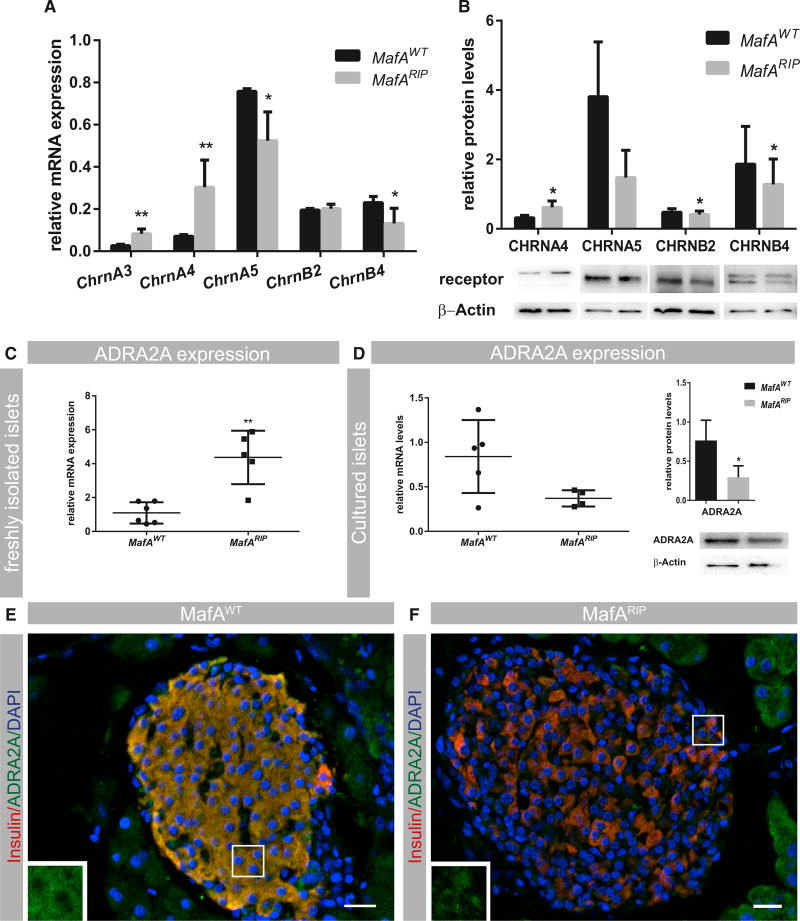
Figure 2. MafARIP Islets Have Altered Neurotransmitter Receptor Expression.
(A) qPCR measurement of nicotinic receptor (Chrn) mRNA expression in freshly isolated MafAWT and MafARIP islets (n ≥ 4).
(B) Quantitative analysis of Chrn protein levels (n ≥ 4).
(C) qPCR measurement of Adra2A mRNA expression in freshly isolated MafAWT and MafARIP islets (n ≥ 4).
(D) Left panel: qPCR measurement of Adra2A mRNA expression in cultured MafAWT and MafARIP islets (n ≥ 4). Right panel: quantitative analysis of ADRA2A protein levels is shown (n ≥ 4). qPCR data were normalized to the geomean of HPRT and β-actin mRNA levels (n ≥4).
(E and F) Immunohistochemistry staining for ADRA2A (green) in MafAWT and MafARIP pancreatic islets, with insulin (red) and nuclear counterstaining with DAPI (blue). ADRA2A expression in β cells is further illustrated by insets presented in the left corner of respective images. The insets were derived from portions of the images marked by white rectangles.
Data are represented as mean ± SEM and were analyzed using the multiple t test (A and C) and ratio t tests (B and D). *p < 0.05 and **p < 0.01. The scale bar represents 20 µm. See Figure S2A for validation of the ADRA2A antibody.

