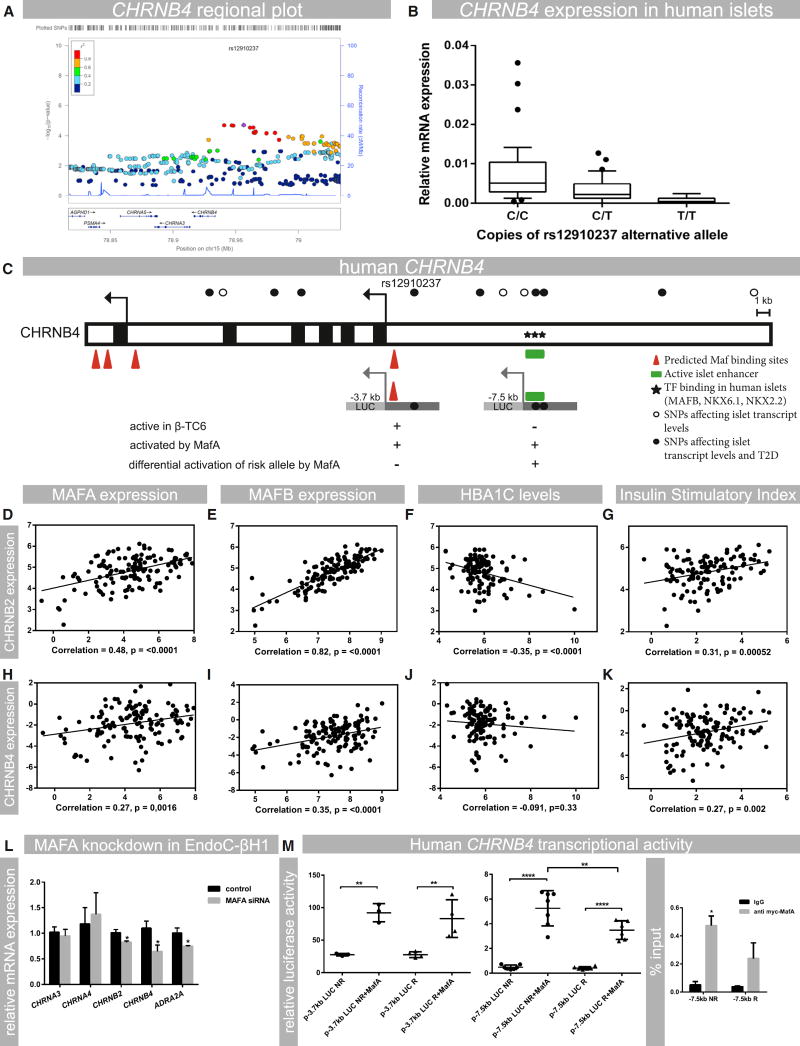
Figure 4. Human Nicotinic Receptor Expression in Islets Is Associated with Type 2 Diabetes and Controlled by MAF Transcription Factors.
(A) Regional plot of the CHRNB4 gene showing the presence of a cluster of SNPs that infer low expression of CHRNB4 in human islets. The leading SNP (rs12910237) is indicated in purple.
(B) Effect of alternate rs12910237 allele copy numbers on CHRNB4 transcript levels in islets from human donors; n = 89 (p = 1.98E–05).
(C) Overview of the CHRNB4 upstream region containing SNPs affecting islet gene transcription and the risk for developing type 2 diabetes. MAF and other transcription-factor-binding sites and active islet enhancer regions are shown (Pasquali et al., 2014). Transcriptional activity in the β cell line β-TC6 and activation by MafA is indicated.
(D–G) Analysis of RNA-seq data from human donor islets to show the correlation between CHRNB2 expression and MAFA and MAFB transcript levels, insulin secretion (stimulatory index), and HbA1c levels.
(H–K) Analysis of RNA-seq data from human donor islets to show the correlation between CHRNB4, MAFA, and MAFB; stimulatory index; and HbA1c levels. Experiments were analyzed with linear regression and Pearson correlation analysis; p values are indicated in the respective graphs; n = 131.
(L) siRNA-mediated knockdown of MAFA in EndoC-βH1 cells, showing the effect on mRNA levels of CHRNB2 (p = 0.04), CHRNB4 (p = 0.05), and ADRA2A (p = 0.055); n = 3 or 4.
(M) Effect of pCMVMafA (MafA) expression on luciferase (Luc) activities of human CHRNB4 upstream reporter constructs (p-3.7kbLUC and p-7.5kbLUC) spanning sequences that contain identified risk(R) and corresponding non-risk alleles (NR) for rs12910237 or rs922691 and islet enhancer regions. Activity was assessed in HEK293 cells, which do not have endogenous MAFA activity. n = 4.
Data are mean ± SEM and were analyzed using one-way ANOVA and Tukey multiple comparison tests (M) and Student’s t test (L). *p < 0.05; **p < 0.01; ****p < 0.001. Abbreviations: T2D, type 2 diabetes; TF, transcription factor. See also Figures S3 and S4 and Table S2 for additional correlation and transcriptional data.

