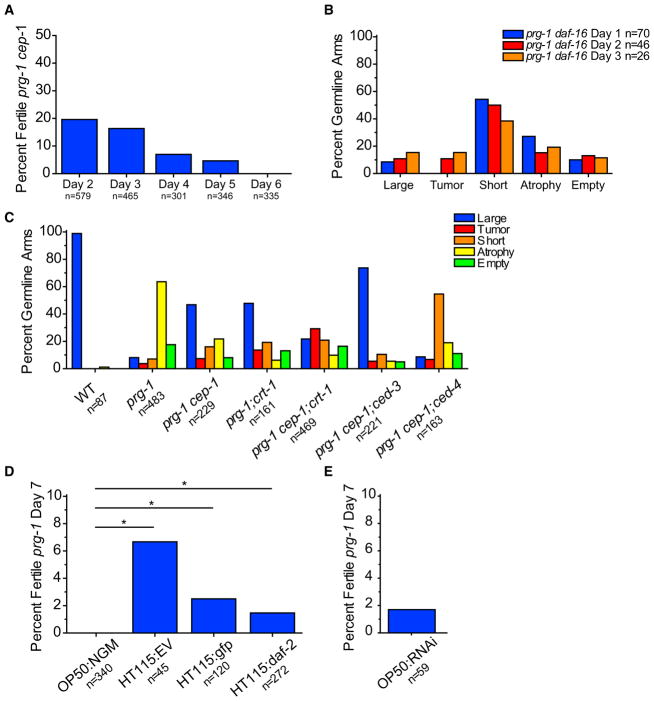
Figure 5. prg-1 Germline Arm Phenotypes and Sterility Can Be Suppressed.
(A) Sterile day 1 prg-1(n4357) cep-1(gk138) animals were scored for continued sterility from days 2 through 6. n represents total worms scored on that day that were previously sterile.
(B) Germline phenotypes of sterile germlines in day 1, day 2, and day 3 prg-1 daf-16 mutants.
(C) Effects of apoptosis and necrotic cell death pathways on sterile germline phenotypes of prg-1. For comparison, we include wild-type, prg-1, and prg-1 cep-1 data that are the same data as shown in Figure 1D. p values were determined using pairwise chi-square tests with Bonferroni correction that can be found in Table S1.
(D) Sterile day 5 prg-1 mutants on either standard laboratory plate NGM plates with OP50 E. coli (OP50:NGM) or on RNAi plates seeded with various bacteria relevant to generating dsRNA (HT115:RNAi clone; EV is empty vector) scored for percent fertility 48 hr after treatment (day 7) *p < 0.05, Fisher’s exact test with Bonferroni correction.
(E) Sterile day 5 prg-1 mutants on OP50 bacteria on standard RNAi plate condition (OP50:RNAi) scored for percent fertility 48 hr after treatment (day 7). Data combined from minimum of three independent experiments; n represents total worms (A, D, and E) or germline arms (B and C) scored.

