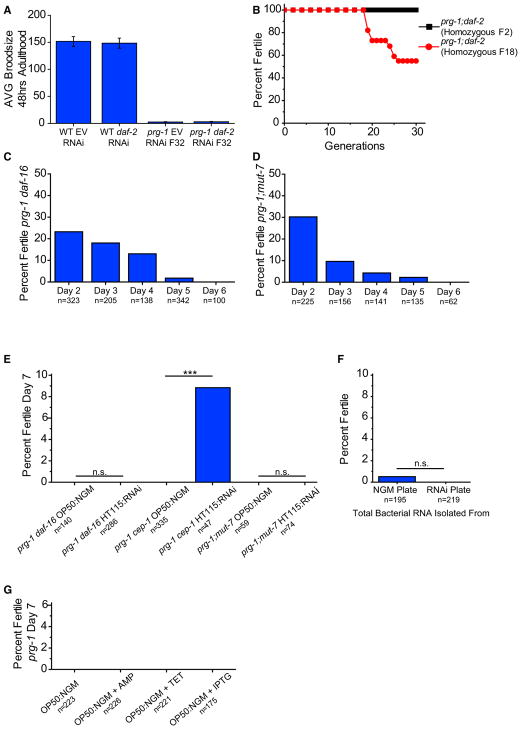
Figure 6. Insulin Signaling and Downstream Small RNA Pathway Are Necessary for Reversal of prg-1-Induced ARD.
(A) Average brood size of day 2 wild-type worms or fertile, late-generation prg-1 mutants on empty vector (EV) or RNAi clone targeting daf-2. Error bars indicate SEM.
(B) Mortality assay for 30 generations of prg-1; daf-2 mutants homozygous at F2 and prg-1; daf-2 mutants that were made homozygous for daf-2 at F18.
(C) Sterile day 1 prg-1(n4357) daf-16 animals were scored for continued sterility from days 2 through 6. n represents total worms scored on that day that were previously sterile.
(D) Sterile day 1 prg-1(n4357) mut-7 (pk204) animals were scored for continued sterility from days 2 through 6. n represents total worms scored on that day that were previously sterile.
(E) Sterile day 5 prg-1 daf-16 or prg-1 cep-1 or prg-1; mut-7 mutants on either standard laboratory NGM plates seeded with OP50 E. coli (OP50:NGM) or standard RNAi plates seeded with HT115 E. coli (HT115:RNAi) scored for percent fertility 48 hr after treatment (day 7). ***p < 0.0001, Fisher’s exact test.
(F) Sterile day 5 prg-1 mutants were treated with total RNA isolated from bacteria on standard laboratory plate conditions (NGM) or standard RNAi plate conditions (RNAi) and scored for fertility. p = n.s., Fisher’s exact test.
(G) Percent fertile sterile day 5 prg-1 mutants on either standard OP50:NGM plate conditions or OP50:NGM with ampicillin (AMP) or tetracycline (TET) or IPTG. Above data combined from minimum of three independent experiments; n represents total worms scored.

