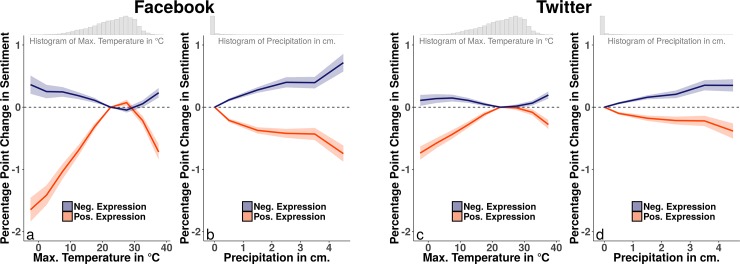
Fig 1. Facebook and Twitter analyses for all message types.
Panel (a) depicts the relationship between daily maximum temperatures and the rates of expressed sentiment of approximately 2.4 billion Facebook status updates from 2009–2012, aggregated to the city-level. It draws from the estimation of Eq 1 and plots the predicted change in expressed sentiment associated with each maximum temperature bin. Panel (b) depicts the relationship between daily precipitation and the rates of sentiment expression of Facebook status updates, also drawing on estimation of Eq 1. Panels (c) and (d) replicate these analyses for nearly 1.1 billion Twitter posts between 2013 and 2016 aggregated to the same cities. Shaded error bounds represent 95% confidence intervals calculated using heteroskedasticity-robust standard errors clustered on both city-year-month and day.

