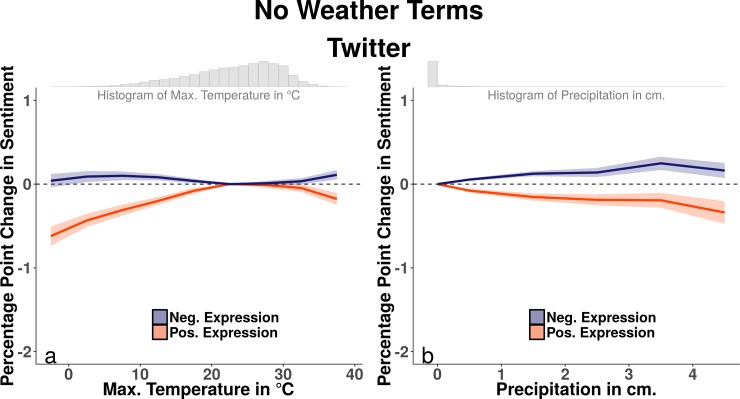
Fig 2. Twitter analyses for posts without weather terms.
Panel (a) depicts the relationship between daily maximum temperatures and the rates of expressed sentiment for non-weather posts, aggregated to the city-level. It draws from the estimation of Eq 1 and plots the predicted change in expressed sentiment associated with each maximum temperature bin. Panel (b) depicts the relationship between daily precipitation and the rates of sentiment expression of non-weather posts, also drawing on estimation of Eq 1. Shaded error bounds represent 95% confidence intervals calculated using heteroskedasticity-robust standard errors clustered on both city-year-month and day.

