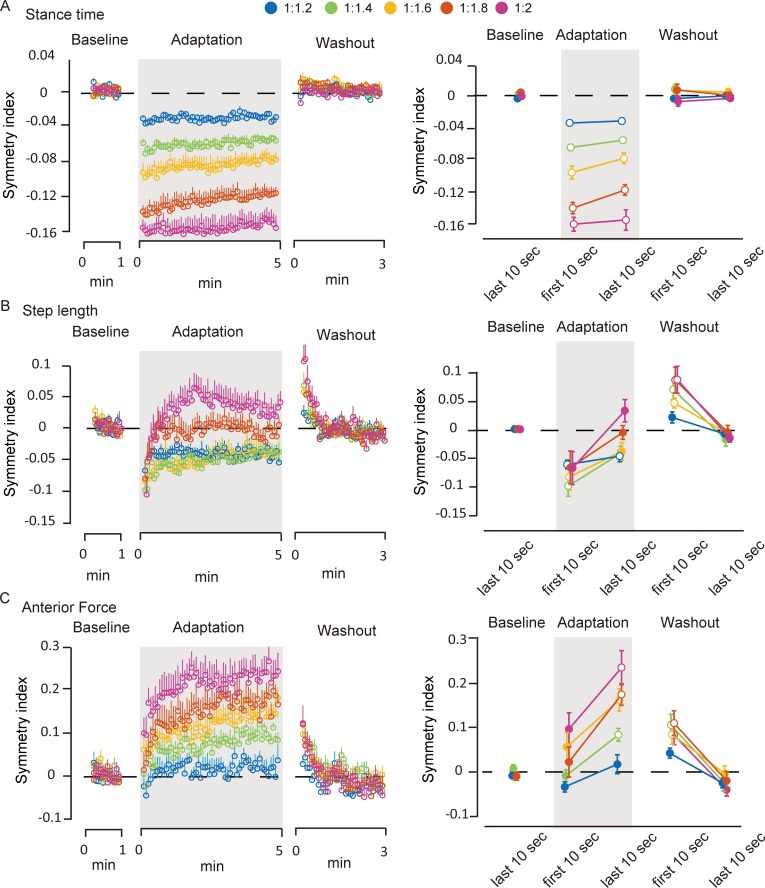
Fig 2.
Time series changes in the symmetry indices of gait parameters (A: stance time, B: step length, C: anterior force). All data were normalized to those under the baseline condition. Left: Time series changes of the mean value of each 5-s bin. Right: Comparisons of each parameter at different time periods (baseline, first adaptation, last adaptation, first washout, and last washout). In the right panels, open circles denote significant differences against to the baseline period. Error bars indicate means ± SE. Significant differences were defined as p < 0.05.

