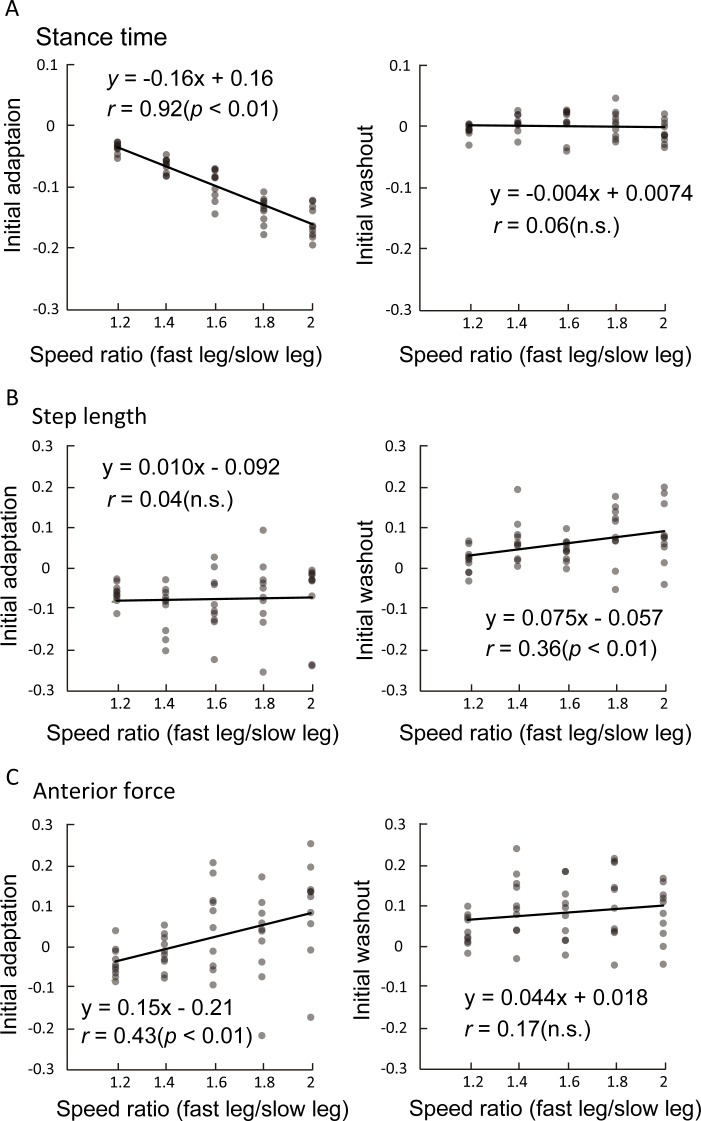
Fig 3.
Relevance of the speed ratio (x-axis) to the symmetry index of stance time (A), step length (B), and anterior force (C) at initial adaptation and initial washout (y-axis). Each plot indicates individual data in each speed ratio. Regression lines and the correlation coefficients and their significance are presented.

