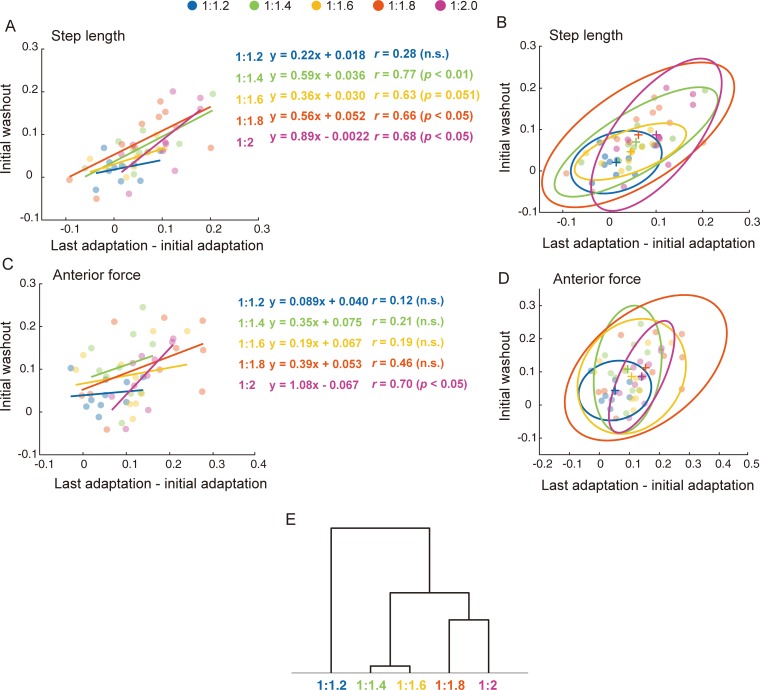
Fig 4. Relationship of the symmetry indices between the extent of adaptation and the initial aftereffect of predictive adapting parameters.
(A, C): Relationship of the symmetry indices between the extent of adaptation (x-axis) and the initial aftereffect (y-axis) for step length and anterior force, respectively. Each plot indicates individual data in each speed ratio. Regression lines and the correlation coefficients and their significance are denoted. (B, D): The open ellipses represent the 95% confidence ellipse for step length and anterior force in each five speed ratio conditions. Each plot indicates individual data. “+” markers indicates the centers of the ellipses. (E): Dendrogram of the hierarchical clustering analysis (Ward’s method, Euclidean distance) for the data sets of adaptive indices among the five speed ratios.

