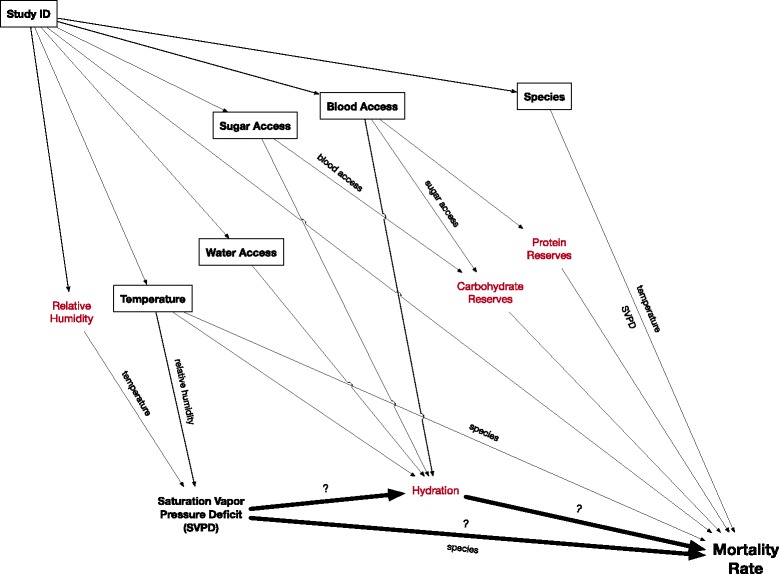
Fig. 1.

Directed acyclic graph (DAG) of hypothesized relationships among modeled exposure and outcome variables. Some hypothesized mediators (red text) were not directly modeled but are included here for explicatory purposes. Boxes reflect conditioning on variables in the statistical models to address potential confounding and colliding bias in estimating the association between SVPD and mortality, with variable names along paths reflecting modeled interactions
