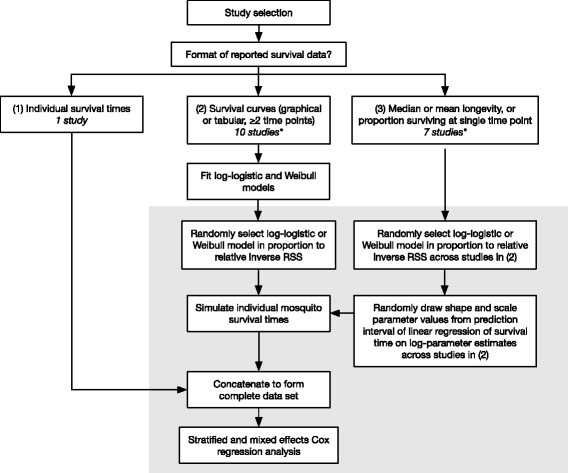
Fig. 2.

Summary flow diagram of survival time simulations. Steps within the gray box were repeated to generate 500 simulated data sets, which were individually analyzed via stratified and mixed effects Cox regression prior to pooling. (*) One study reported some experiments as survival curves and some as median longevities
