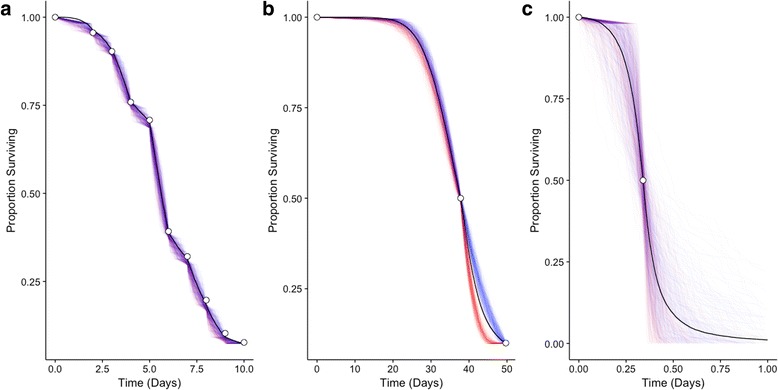
Fig. 3.

Example simulated survival curves for individual experiments. a A right-censored experiment with reported survival observations at numerous time points (Aedes aegypti at 24.1 °C and 75% RH, with water but no nutrition supplied; Alto et al. [70]). b A right-censored experiment with sparse reported survival observations (Ae. albopictus at 32.2 °C and 60% RH, with sugar solution supplied; Hylton [98]). c An experiment with only median longevity reported (Ae. aegypti at 0.5 °C and 85% RH, with no water or nutrition provided; Bar-Zeev [66]; x-axis has been truncated for display purposes). All 500 simulated data sets are shown for each experiment. Survival curves are colored according to their fitted model: Weibull (red), log-logistic (blue), or aggregate (black; all simulated data). Open circles indicate reported observations
