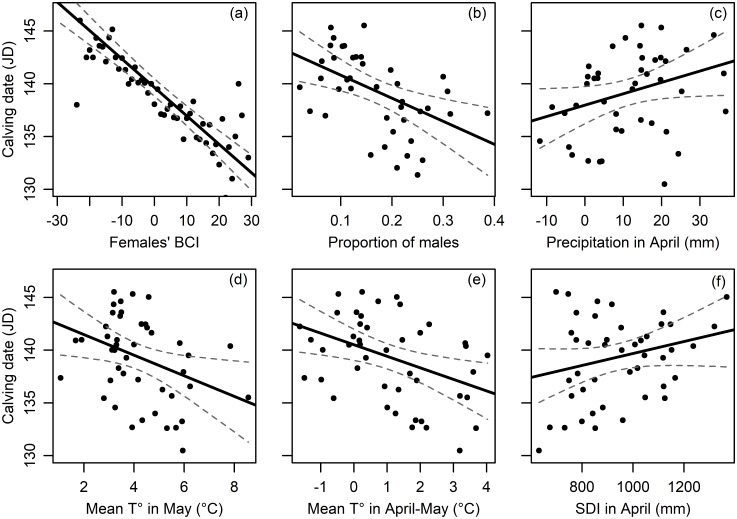
Fig 3. Relationship between reindeer calving date from the Kutuharju field reindeer research station herd from 1970 to 2016 and (a) females’ body condition index (BCI), (b) proportion of males in the herd the precedent breeding season, (c) amount of precipitation in April, (d) mean temperature in May, (e) mean temperature in April-May and (f) snow depth index (SDI) in April.
The 95% confidence interval band around the fitted line is provided. The calving date is expressed in Julian day (JD) starting January 1st. Each point represents the average value of the predictor variable for a specific calving date.

