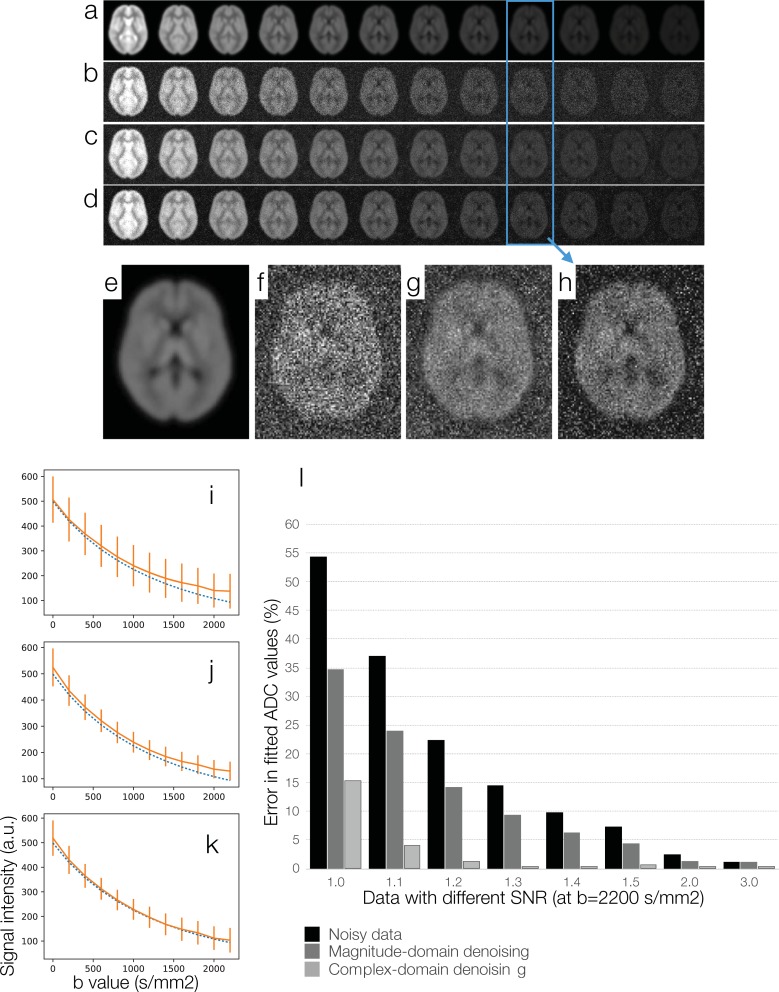
Fig 3.
A simulation study for comparing magnitude-domain DM-PCA and two-channel complex-domain DM-PCA in terms of the accuracy in ADC fitting: (a) Noise-free DWI data corresponding to b = 0, 200, 400 … 2200 (s/mm2). (b) DWI data affected by Rician noise. (c) DWI data denoised by magnitude-domain DM-PCA. (d) DWI data denoised by a two-channel complex-domain DM-PCA procedure. (e) Signal intensities of noisy DWI data (solid curve in orange) and the ground truth (dashed curve in blue). (f) Signal intensities of magnitude-domain DM-PCA produced data (solid curve in orange) and the ground truth (dashed curve in blue). (g) Signal intensities of complex-domain DM-PCA produced data (solid curve in orange) and the ground truth (dashed curve in blue). (h) Errors in ADC fitting for data with different SNR levels.

