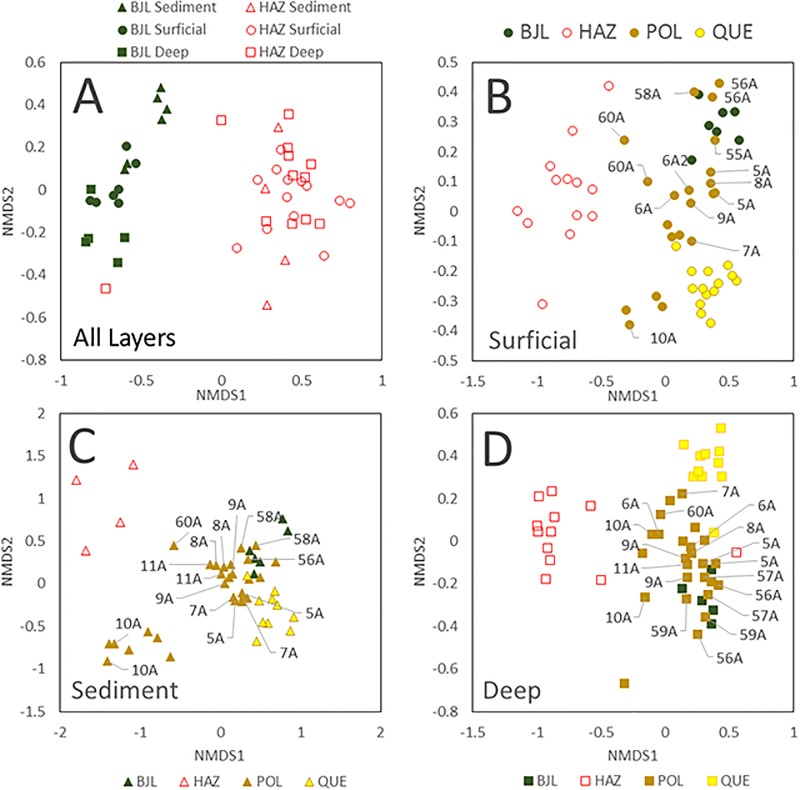
Fig 6. Ordination plots comparing.
(A) the microbial population structures of sites in Bootjack Lake (BJL) and Hazeltine Creek (HAZ) (symbol shapes reflect layers from which samples were collected), (B) the surface layer microbial population structures among the lakes and Hazeltine Creek, (C) the deep layer microbial population structures from the different lakes and Hazeltine Creek, and (D) the sediment layer microbial population structures from the lakes and Hazeltine Creek. Sites on Polley Lake (brown symbols) closest to the impoundment are labeled with their site numbers.

