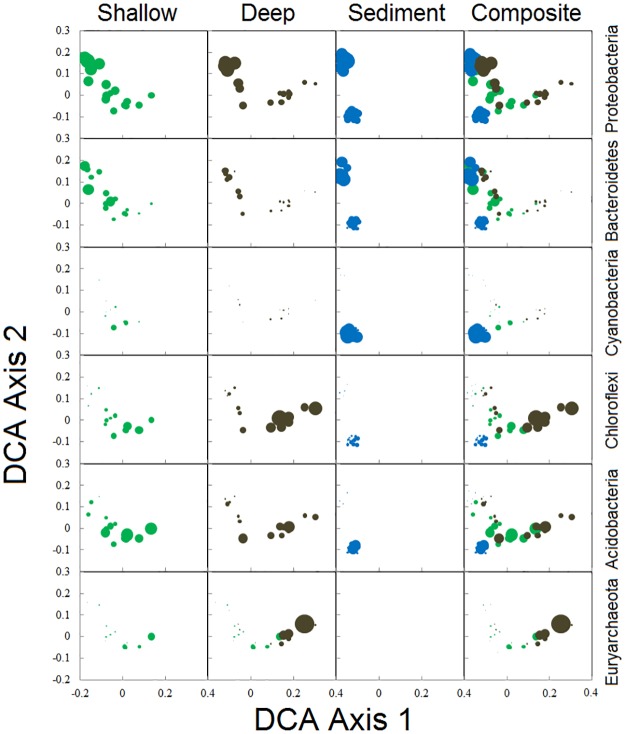
Fig 8. Detrended correspondence analysis depicting Polley Lake community dissimilarity based on reconstructed OTUs for each of the three sample types.
Bubble size varies in proportion to relative abundance of each major taxonomic group (Phylum) listed to the right. Bubble color highlights the three sample types collected (green = surficial, black = deep, and blue = sediment).

